GIS StoryMaps - The Brief History of Hip Hop
During my sophomore year of high school, I attended a summer program, learned about GIS, and created a GIS StoryMaps about topics we found interesting. Here is an article I was featured in.

Computer Science & Data Analytics

Hi! I'm Hailey, an aspiring Data Analyst!
I graduated in December 2024 with a Bachelor of Science in Computer Science from the University of Houston - Clear Lake. For the past seven years, I've been academically determined and willing to make sure I achieve greatness and go the extra mile. My strengths include being a hard worker, dedicated, self-motivated, organized, and working well under pressure. I'm interested in Data Analytics and earning certifications while getting my degree.
While attending UHCL, I am a member of the UHCL Black Student Association, the Society of Women Engineers, the Association for Computing Machinery for Women, and the National Society for Black Engineers. I am currently learning more about Computer Science and coding. I am also attending various women in STEM conferences, finding internships to find my passion in Computer Science, and coding projects to gain experience and learn more about programming.
I attended the Young Women's College Preparatory Academy during middle school. The teachers highly encouraged young women to pursue careers in STEM, so from a young age, I was interested in STEM careers. I completed an Information Technology class in 8th and 10th grade, a PAP Computer Science course in 11th grade, and an AP Computer Science A to help further my interests in Computer Science and get more experience with coding. With my curiosity for Computer Science, I took edX courses, worked on coding on Minecraft with my school, and coded on code.org many times during school. I graduated in May 2021 from Shadow Creek High School (GPA 3.67/4.00), where I was also a Dual Credit student attending Alvin Community College (GPA 3.45/4.00).
Here are my current skills. I'm always working on getting more familiar with different software, certifications, and programming languages, so more will be added soon!
Here are some projects I've worked on so far. Some are personal projects I'll work on by myself, and others are projects I've completed as assignments for my classes & programs I've attended outside of school.

During my sophomore year of high school, I attended a summer program, learned about GIS, and created a GIS StoryMaps about topics we found interesting. Here is an article I was featured in.
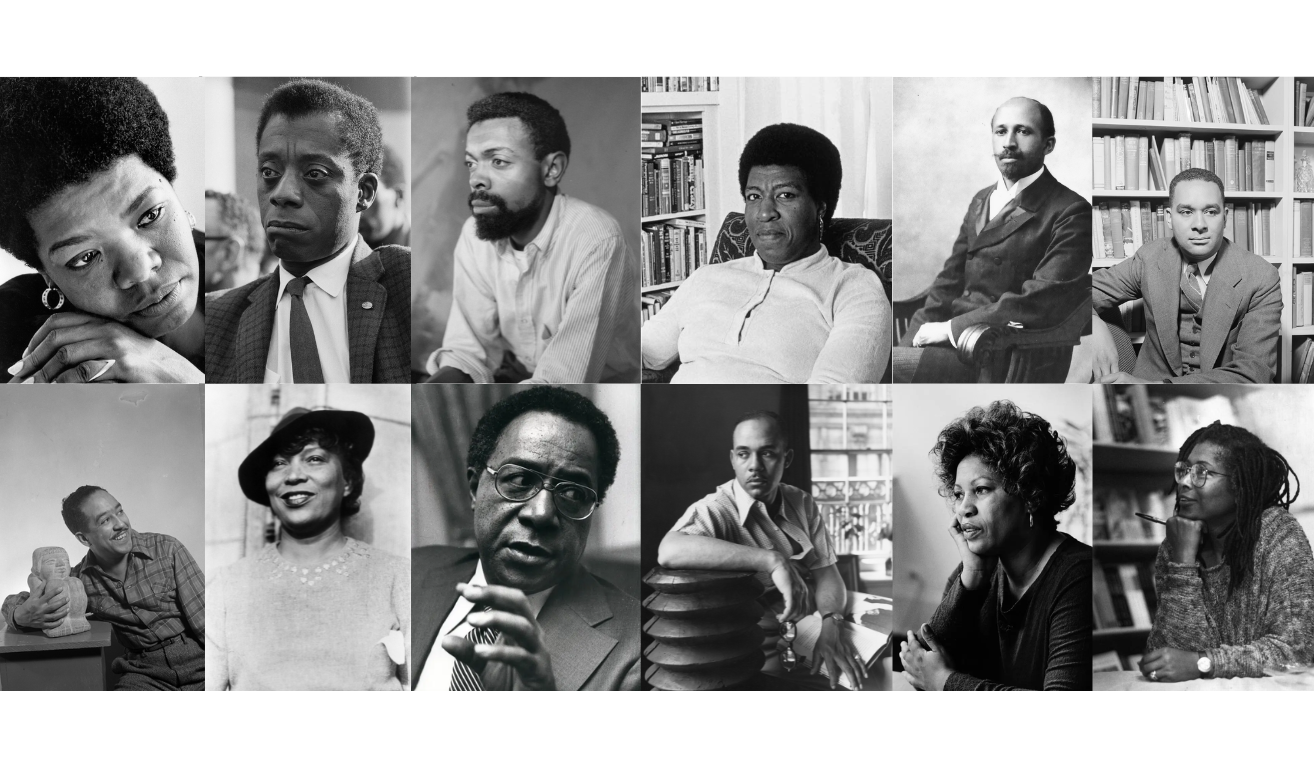
During my junior year of college, I created a StoryMap on a topic I found interesting for my Fundamentals of GIS class. As part of my passion for geography and data visualization, I undertook a GIS StoryMap project to create an immersive and interactive narrative showcasing the historical and cultural significance of African-American literature. Utilizing Geographic Information Systems (GIS) technology, I integrated maps, multimedia, and textual content to trace the literary journeys of influential African-American writers. The project highlighted their impact on black literature, connecting their works to geographical locations and historical contexts. Through this project, I aimed to promote awareness of the rich heritage of African-American voices and foster a deeper appreciation for their contributions to the literary world.
During my sophomore year of college, we had to create a final project in my Computer Science I (CSCI 1470) class.
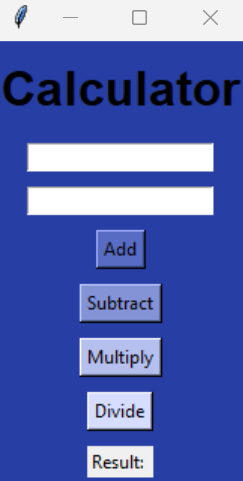
Here is a Calculator project I worked on during the summer of 2023. I wanted to create something simple, easy to use, and accurate. Clicking on the photo will send you to the GitHub repo!
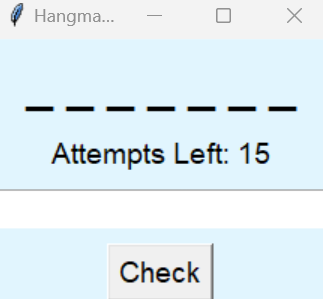
Here is a Hangman game I worked on during the summer of 2023. I wanted a simple look, but a challenging game for users, and I had fun creating it. Clicking on the photo will send you to the GitHub repo!
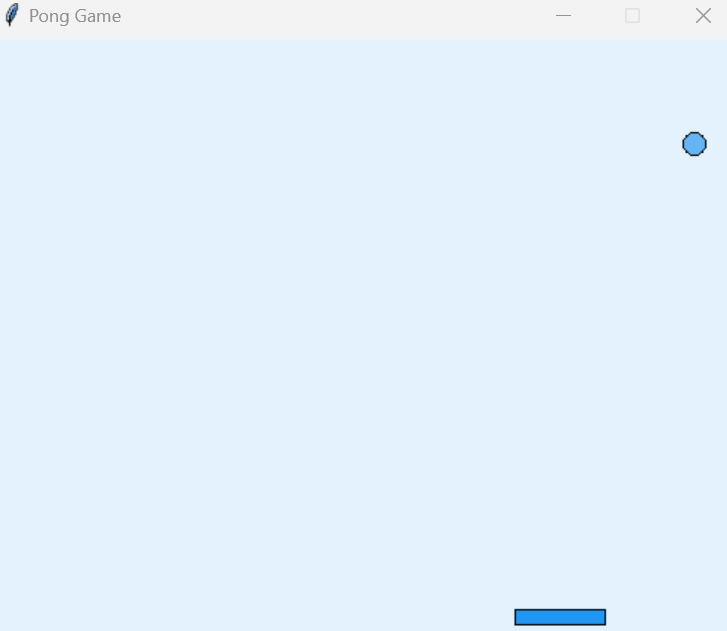
Here is a Pong game I worked on during the summer of 2023. I wanted a simple look, but a fun, easy game for users, and I had fun creating it. Clicking on the photo will send you to the GitHub repo!
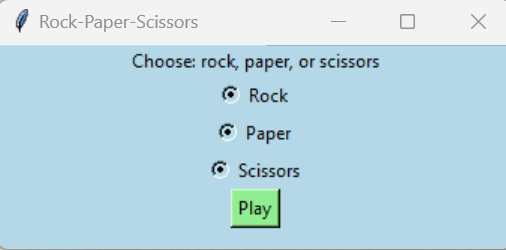
Here is a Rock, Paper, Scissors game I worked on during the summer of 2023. I wanted to make a simple look, but a fun game for users to go against the computer, and I had fun creating it. Clicking on the photo will send you to the GitHub repo!
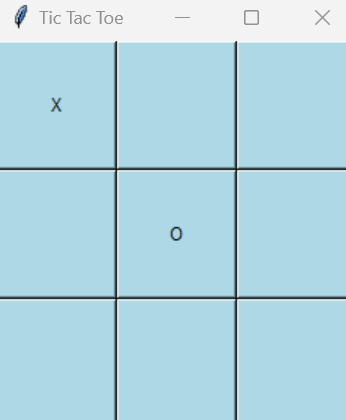
Here is a Tic Tac Toe game I worked on during the summer of 2023. I wanted to make a simple look, but a fun game for users (2 at one time), and I had fun creating it. Clicking on the photo will send you to the GitHub repo!

This a project I worked on during the summer of 2023. After running the code, you'll be able to receive a random, 16-character password. Clicking on the photo will send you to the GitHub repo!

Here is a Clock (H:M:S) I worked on during the summer of 2023. I wanted to make it very simple and easy to use. Clicking on the photo will send you to the GitHub repo!

Thanks to completing Codédex's The Legend of Python course, I was able to follow the guided tutorial to create the GIF you see below. Clicking on the photo will send you to the GitHub repo!
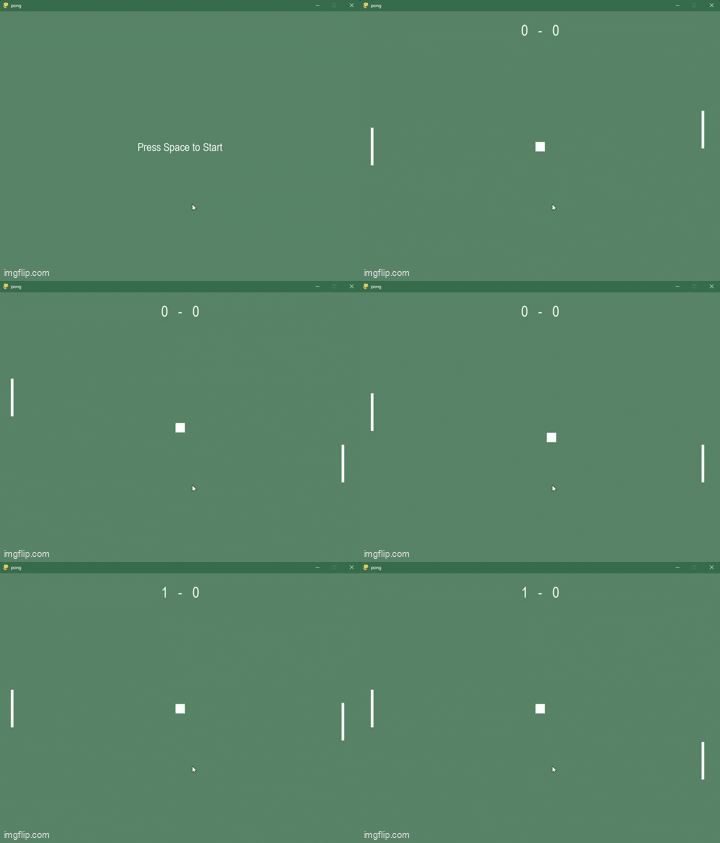
This project is a simple implementation of the classic Pong game using the Pygame library in Python. It was created as part of Codedex's Python projects. Clicking on the photo will send you to the GitHub repo!
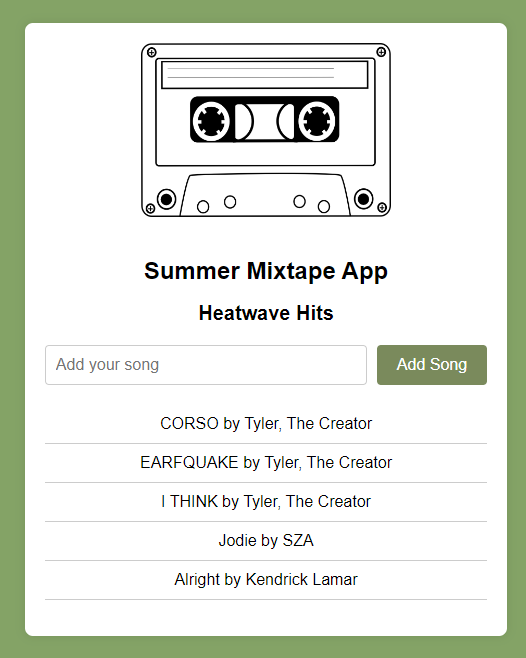
This application was created using VS Code, HTML, CSS, and JavaScript. I was able to connect to the Spotify API and use the Spotify Client ID and Spotify Client Secret to use the Spotify API to generate songs based on user input. Clicking on the photo will send you to the GitHub repo!
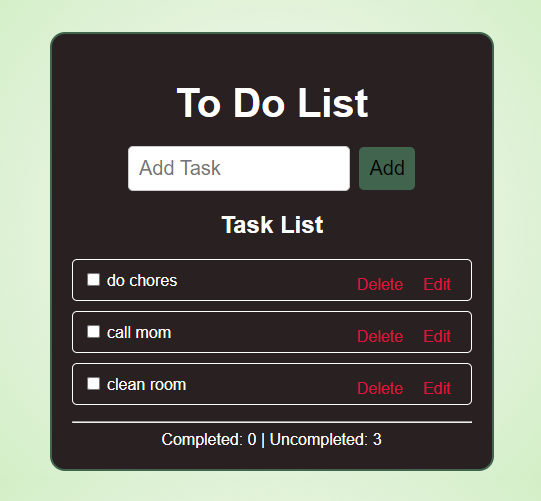
I created this to-do list application with JavaScript, HTML, and CSS on VS Code. I wanted to upgrade my previous application that used Python and Tkinter to make it more user-friendly, edit tasks, add checkboxes, and of course add and delete tasks. Clicking on the photo will send you to the GitHub repo!
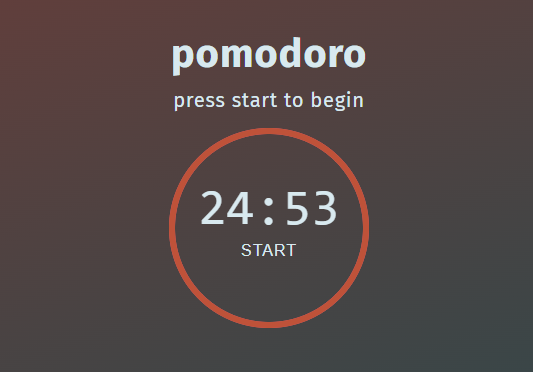
This Pomodoro Timer application was created with HTML, CSS, and JavaScript. I was able to follow a Codedex tutorial on this project to create this. Clicking on the photo will send you to the GitHub repo!
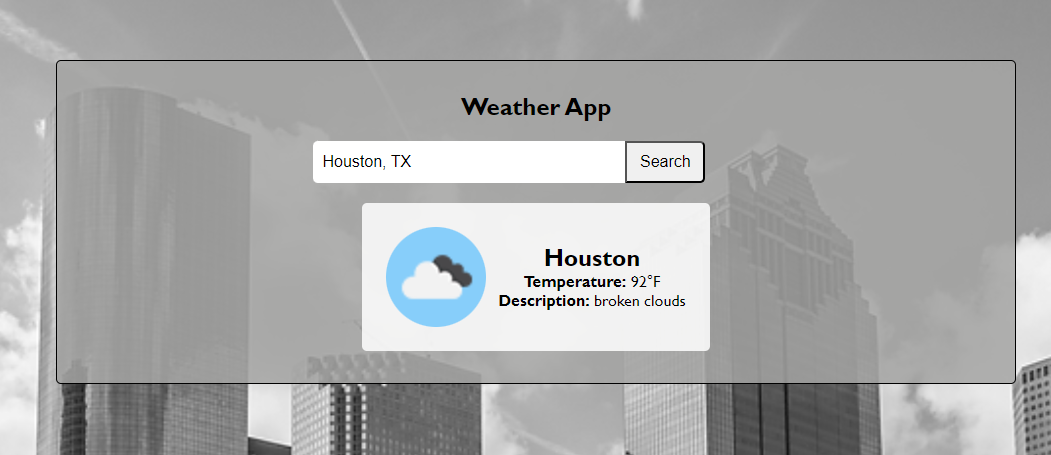
I created this application using HTML, CSS, JavaScript, and Visual Studio Code. I was able to connect to weather.com's API to display the weather in Fahrenheit and a description of the weather along with an icon of the weather. I was able to follow along with Codedex's Weather Application to create this. Clicking on the photo will send you to the GitHub repo!
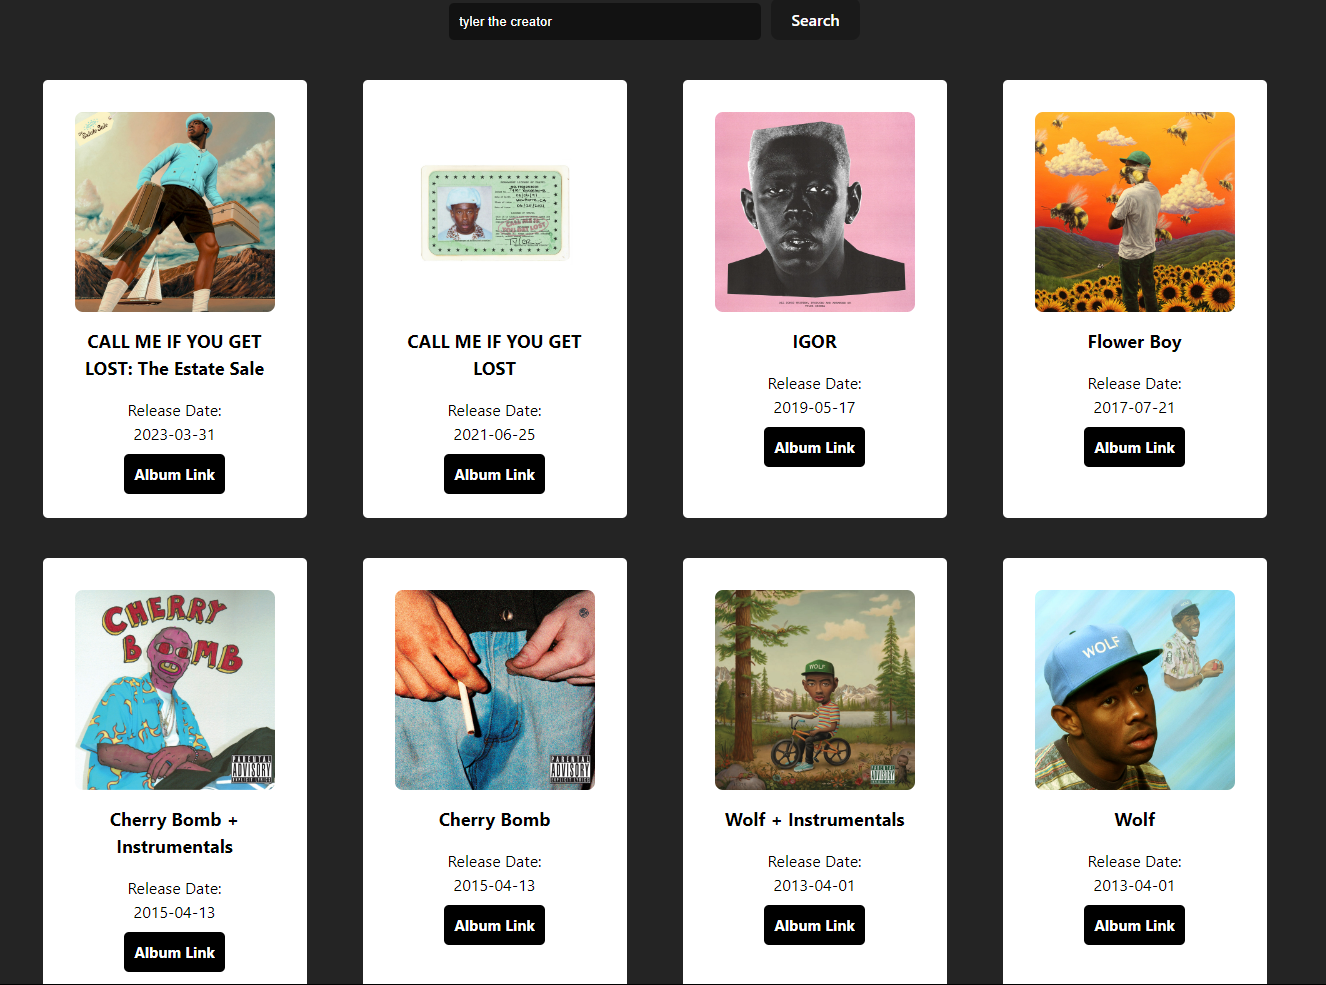
I developed an interactive web application called Album Finder, utilizing the Spotify API to search and display albums from various artists. This project was built to enhance my web development skills and to gain hands-on experience with APIs and modern JavaScript frameworks. Clicking on the photo will send you to the GitHub repo!
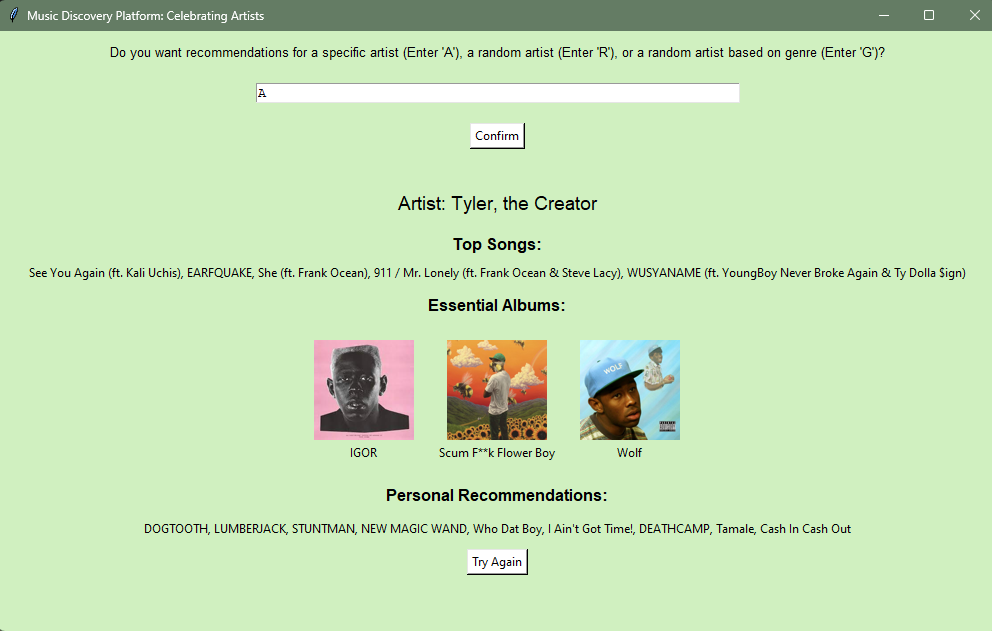
I developed a Tkinter music exploration platform focused on showcasing the talent of over 450+ African American and Black artists. Users can discover music from artists like Tyler, the Creator, Bell Biv Devoe, Michael Jackson, Missy Elliot, and SZA. Users can also discover my personal song recommendations, explore top songs, and essential albums, fostering a deeper connection with diverse musical expressions.
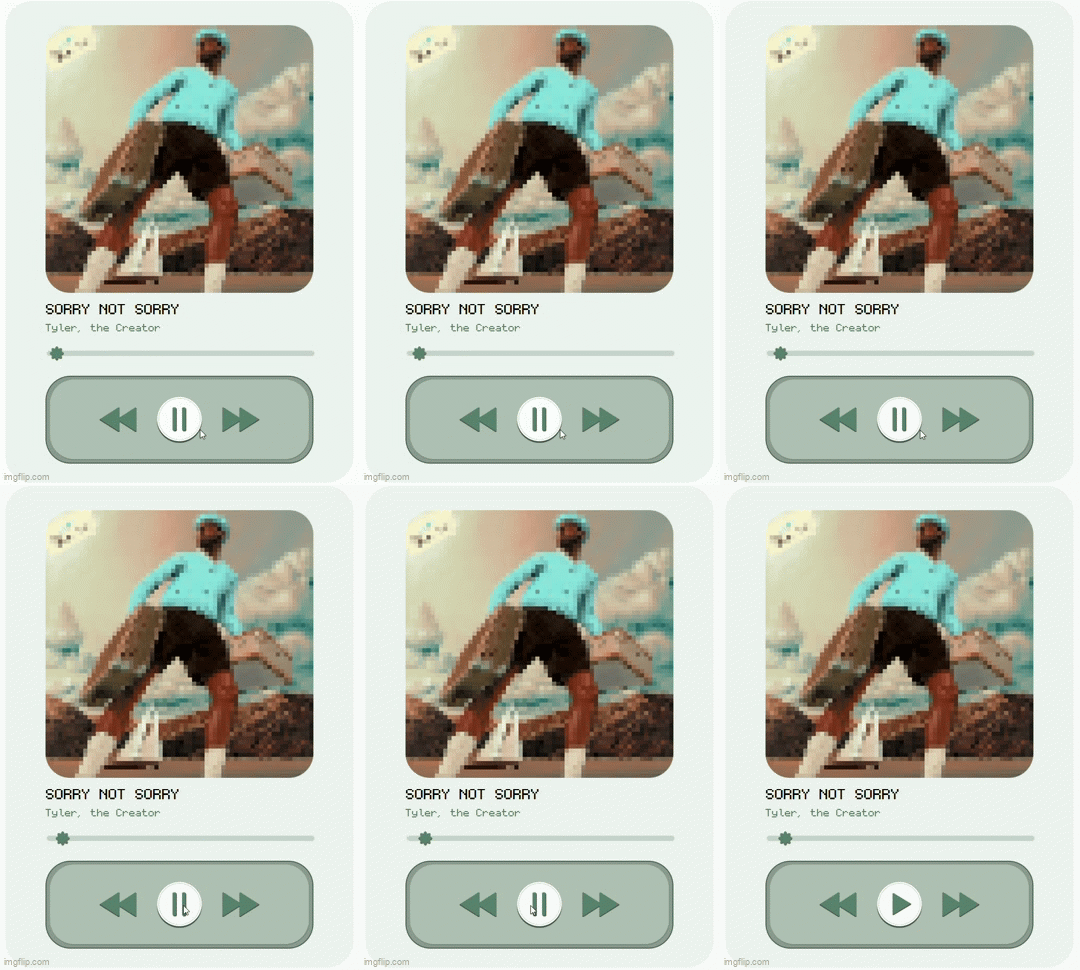
This music MP3 player is an interactive web-based MP3 player experience that lets users listen to songs. Built with JavaScript, HTML, and CSS, this project allows user to experience listening to music with a nostalgic feel to MP3s and current interface similar to Apple Music. Clicking on the photo will send you to the GitHub repo!

I created a QR code generator using Python. I was able to create the project with the Generate a QR Code with Python project from Codedex.
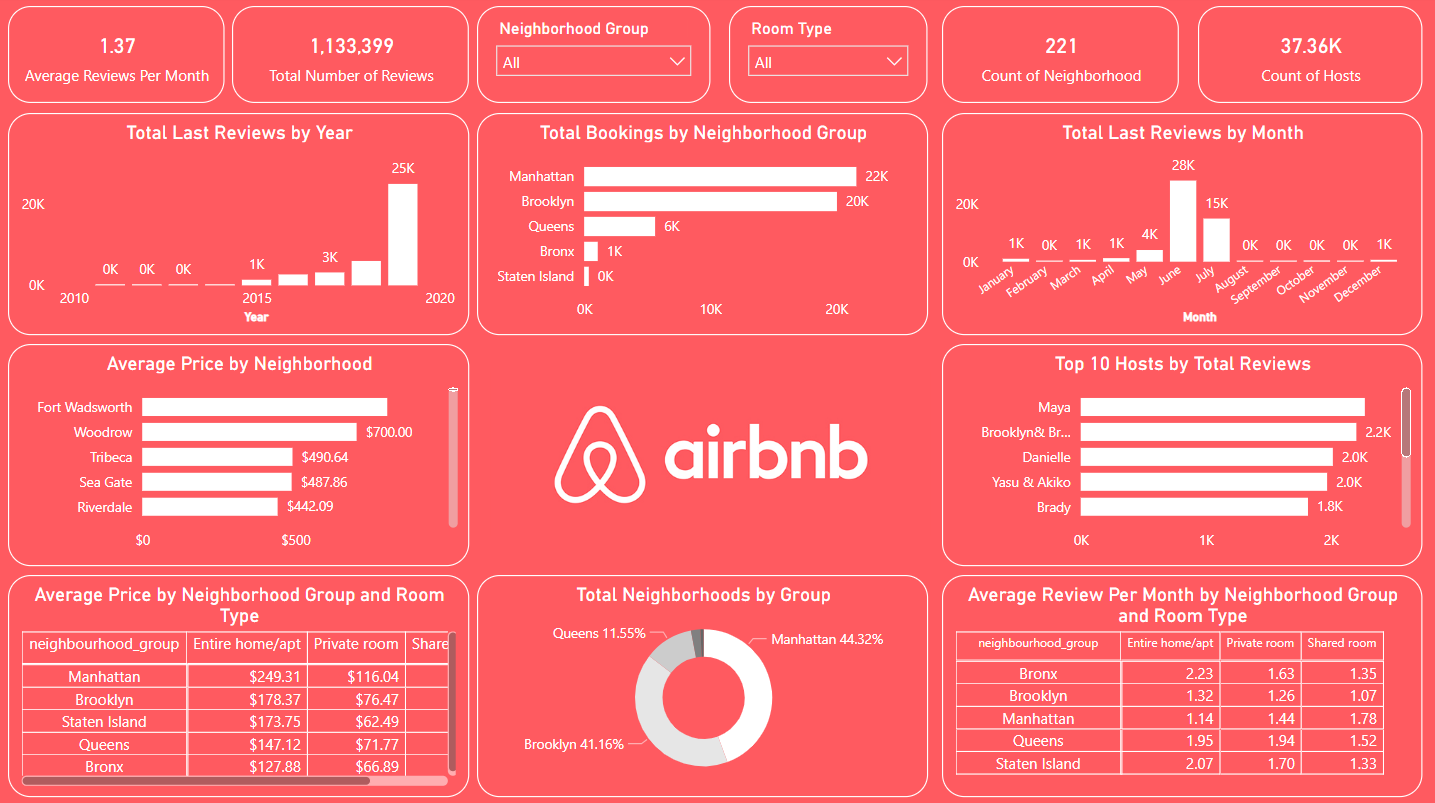
Visualizes average reviews per month, total reviews, neighborhood group slicer, room type slicer, and more to provide insights into Airbnb listings in NYC.
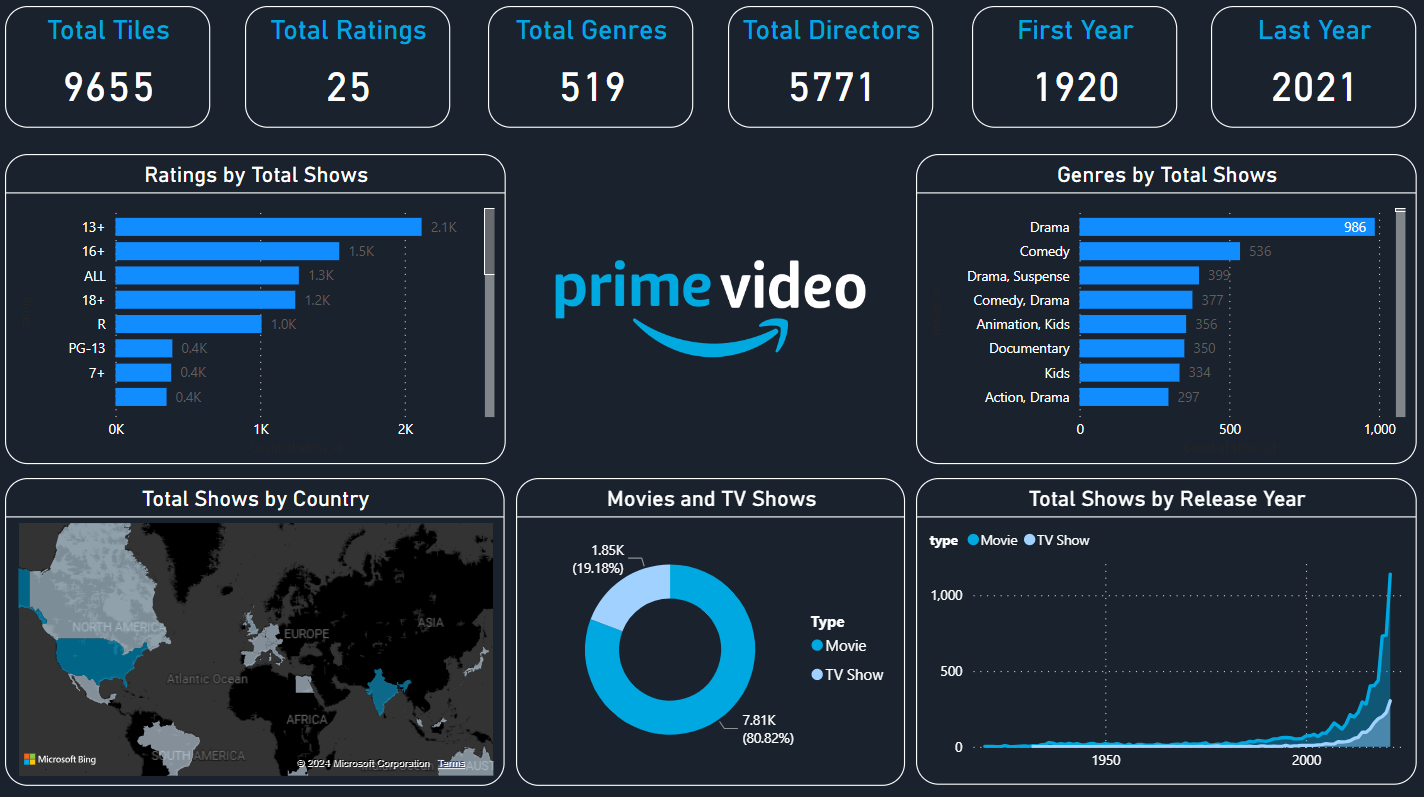
Displays total titles, total ratings, genres, directors, first and last year, and more, offering a comprehensive overview of Prime Video's content.
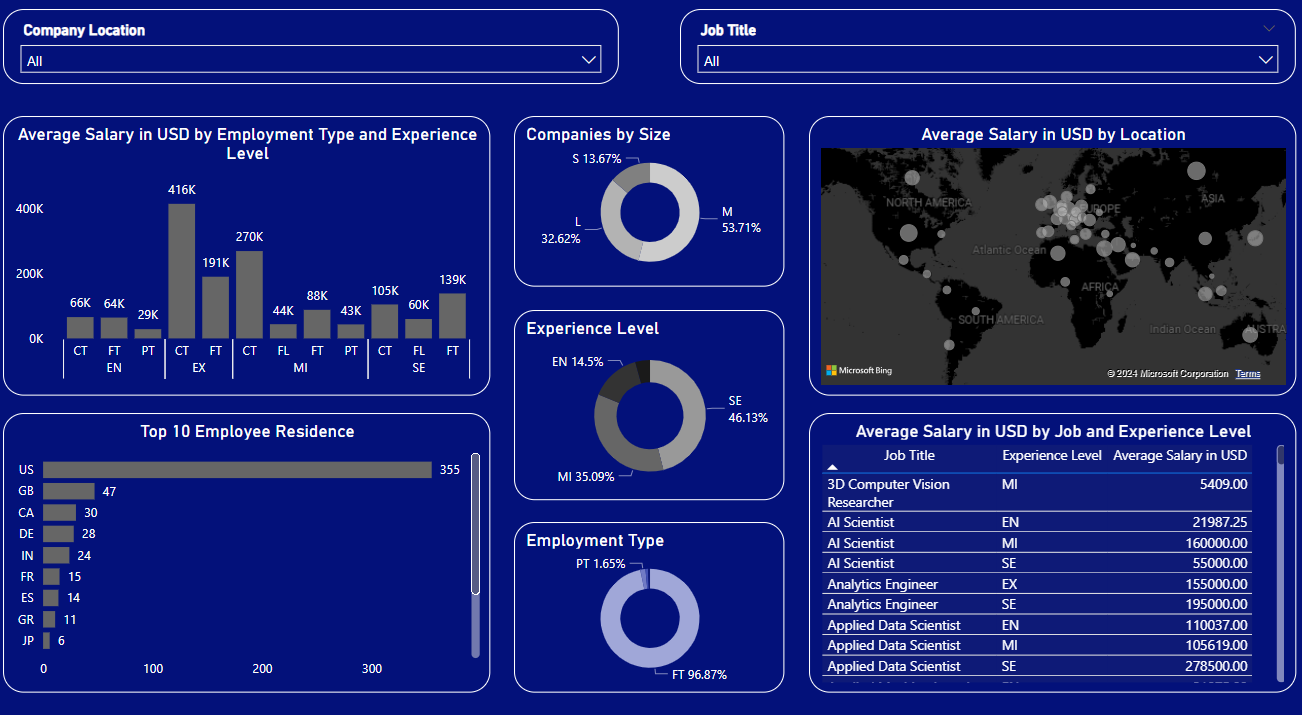
Shows company location and job title slicers, average salary by employment type and experience level, and more, providing an in-depth look at data science salaries.
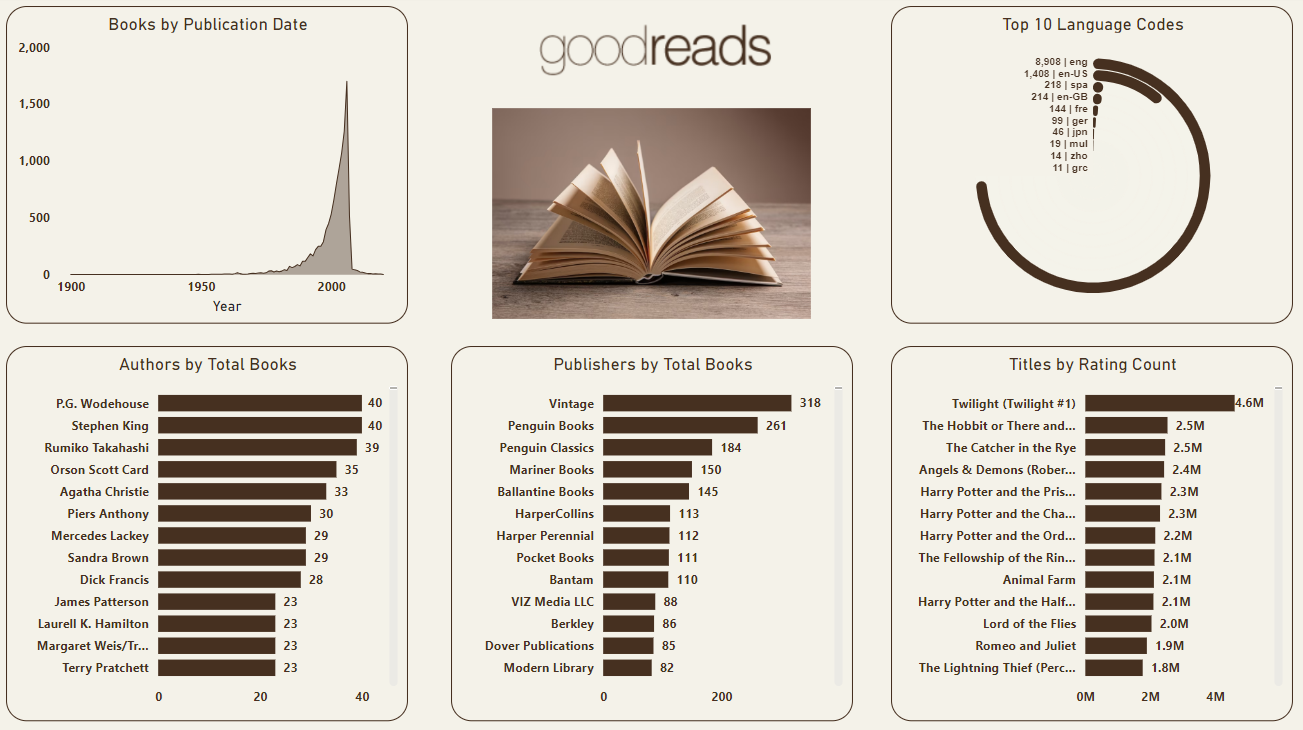
Visualizes books by publication date, top language codes, authors, publishers, and ratings, offering insights into Goodreads' book database.
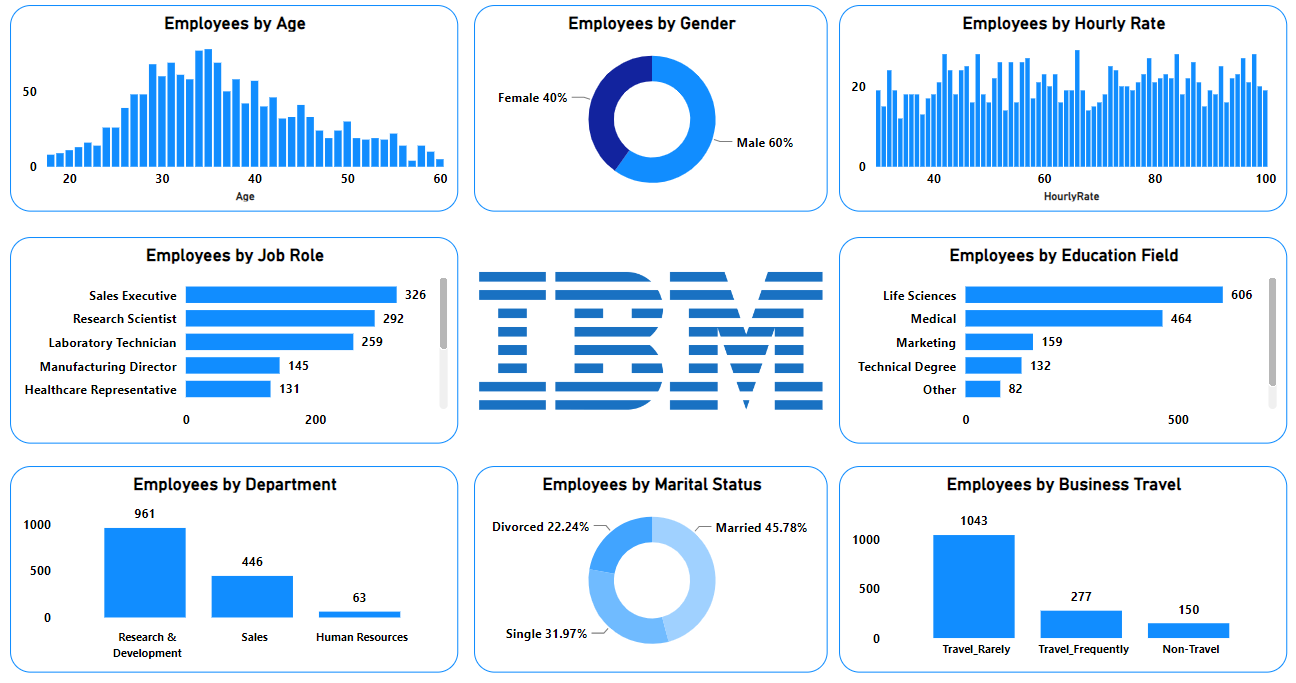
Displays employee demographics such as age, gender, hourly rate, job role, education field, and more, providing detailed HR analytics.
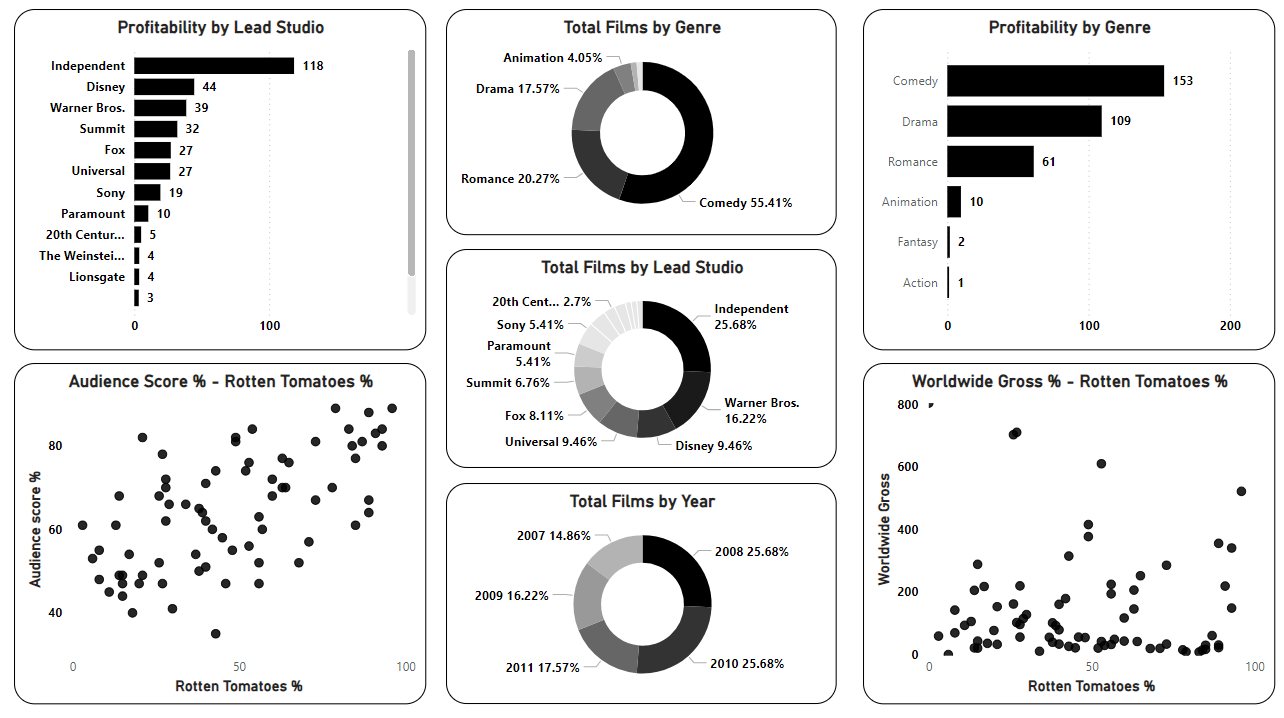
Shows profitability by lead studio, genre, year, and more, analyzing the financial success of top movies.
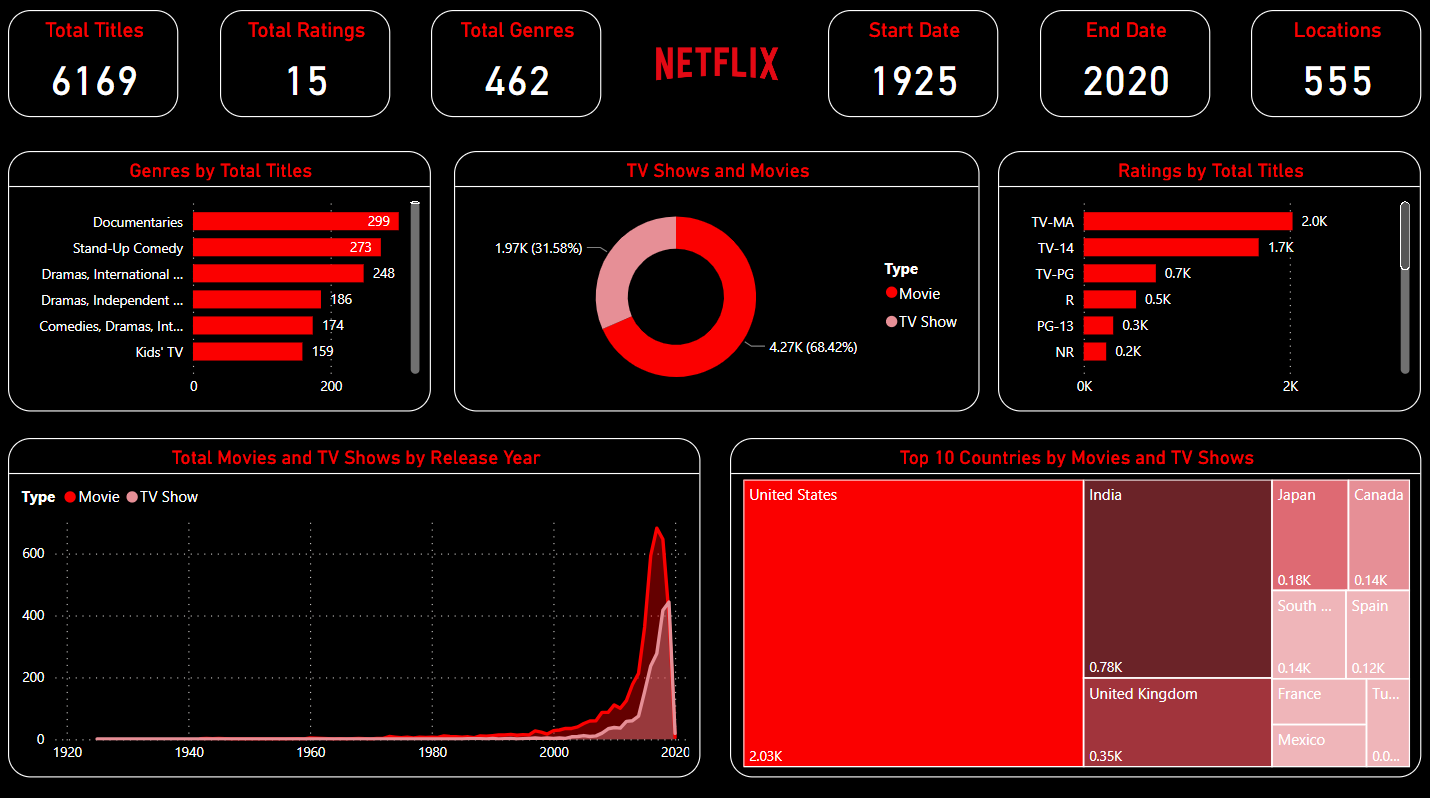
Highlights total titles, ratings, genres, release years, and top countries, offering insights into Netflix's content library.
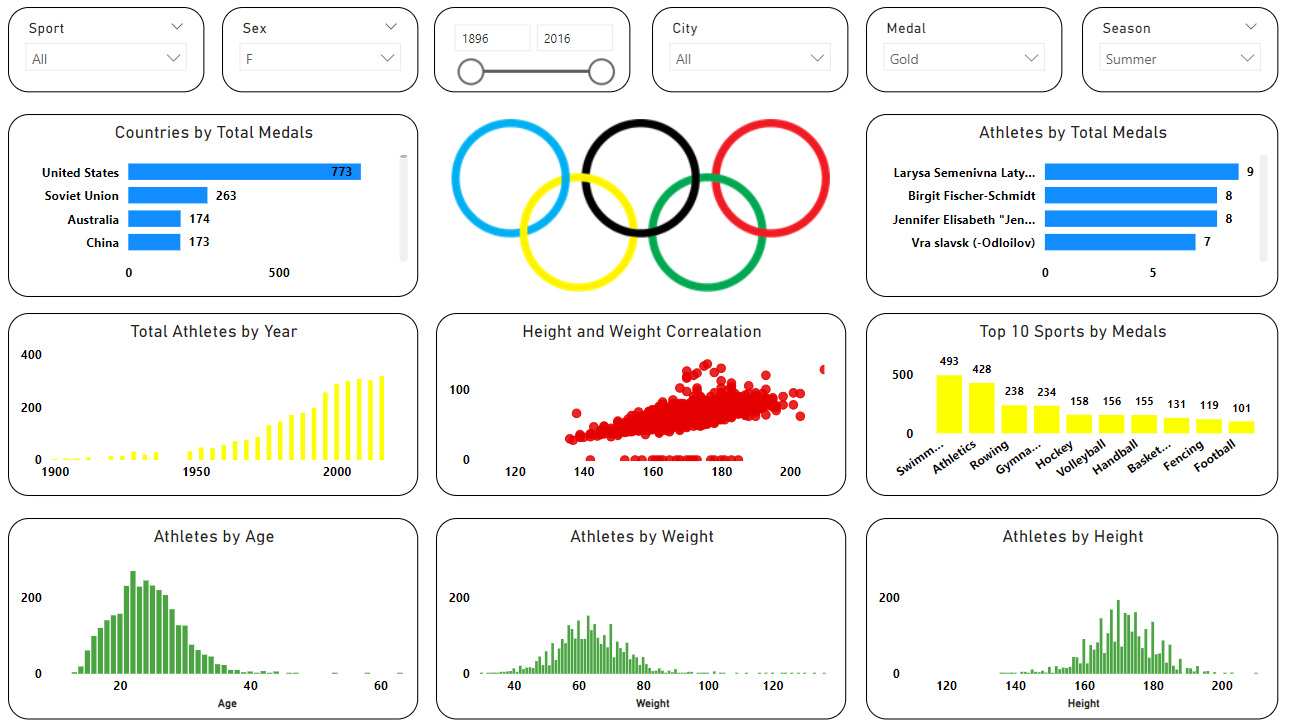
Features total medals by country, athletes by various metrics, and more, providing a comprehensive look at Olympic history.
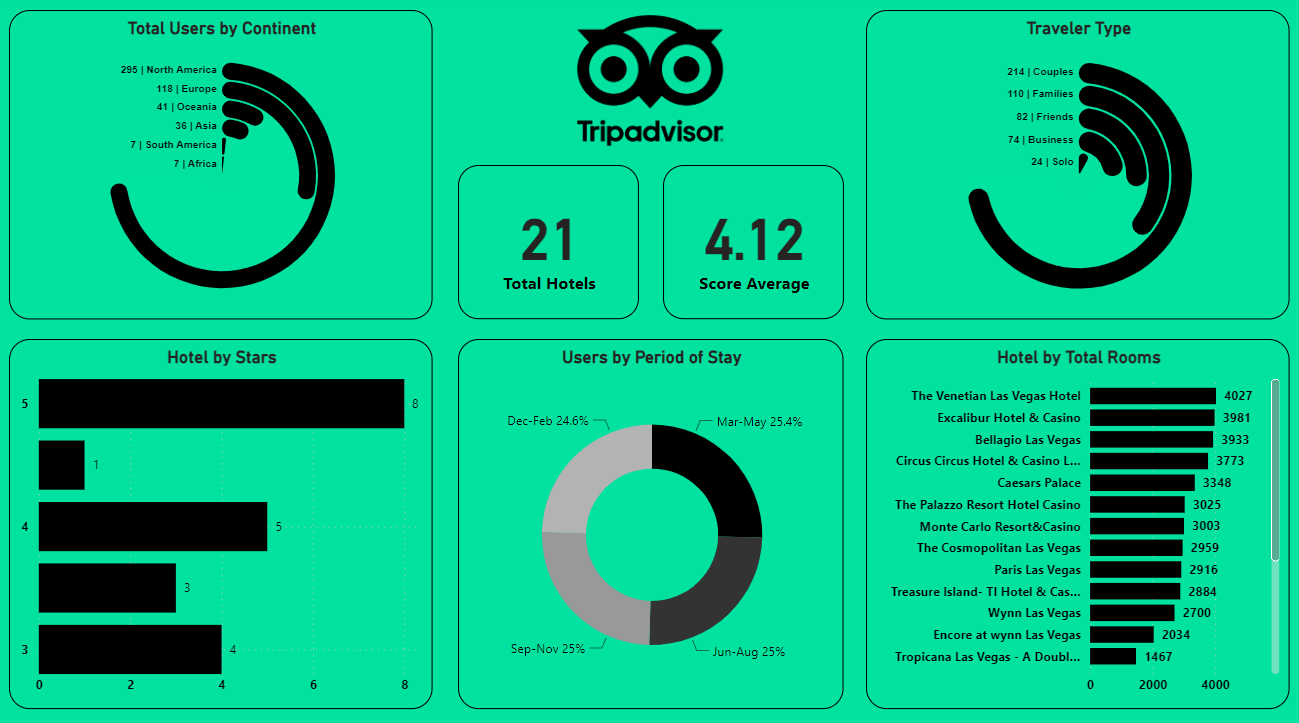
Displays total users by continent, total hotels, average scores, hotel by stars, and more, visualizing key statistics from TripAdvisor.
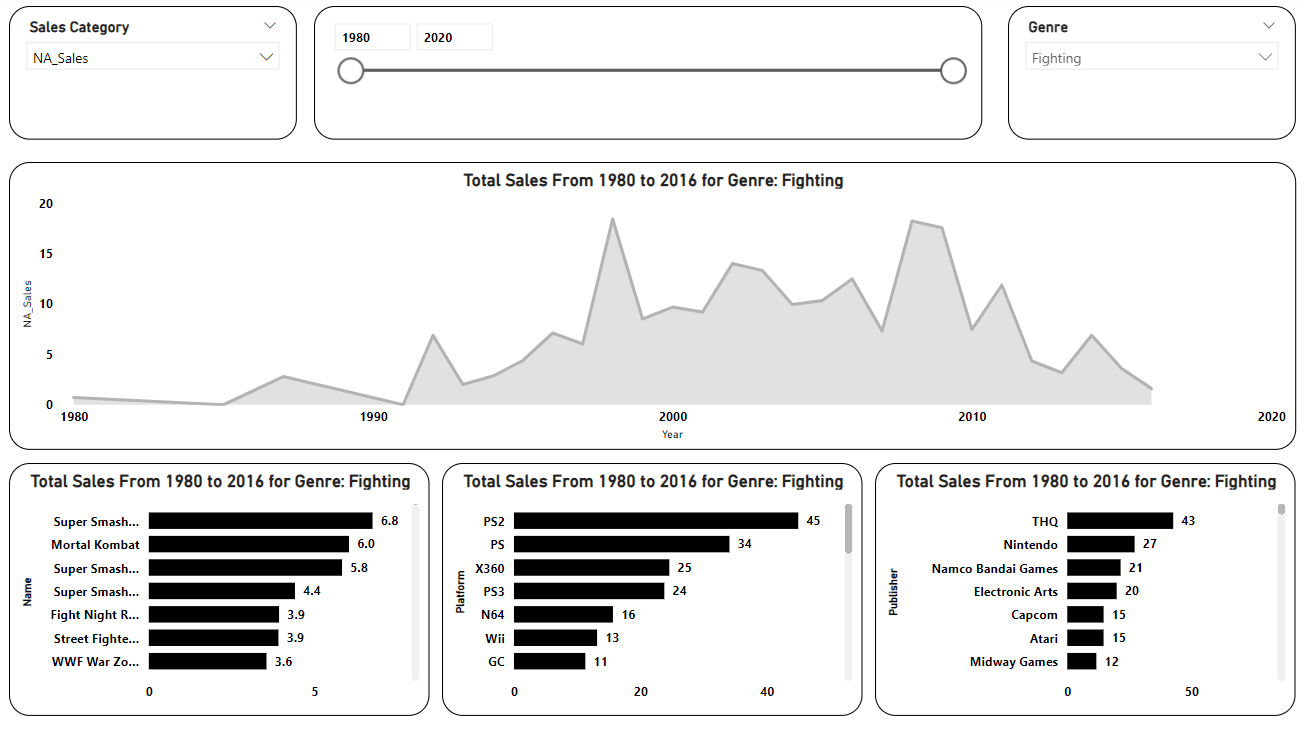
Analyzes sales by continent, year, genre, platform, and publisher, providing insights into the video game industry's sales trends from 1980 to 2016.
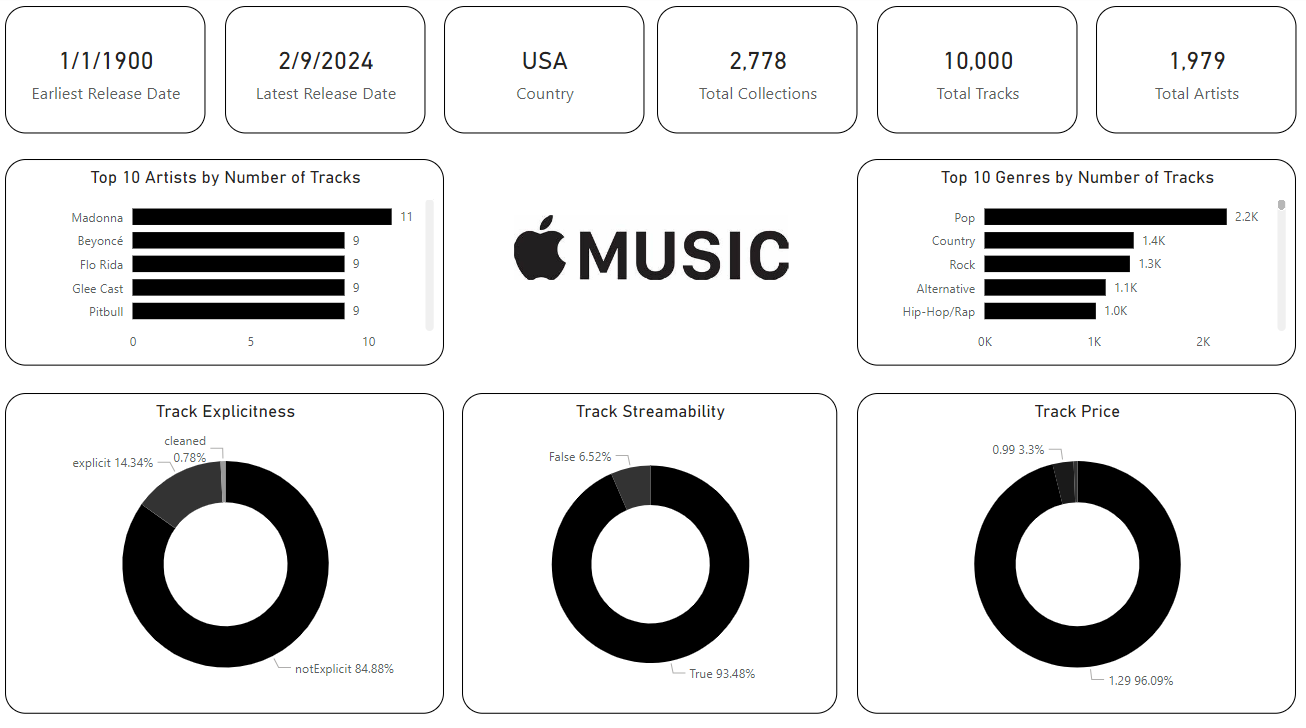
Shows earliest and latest track release dates, country, total collections, tracks, and artists, top 10 artists and genres by track number, track explicitness, streamability, and price.
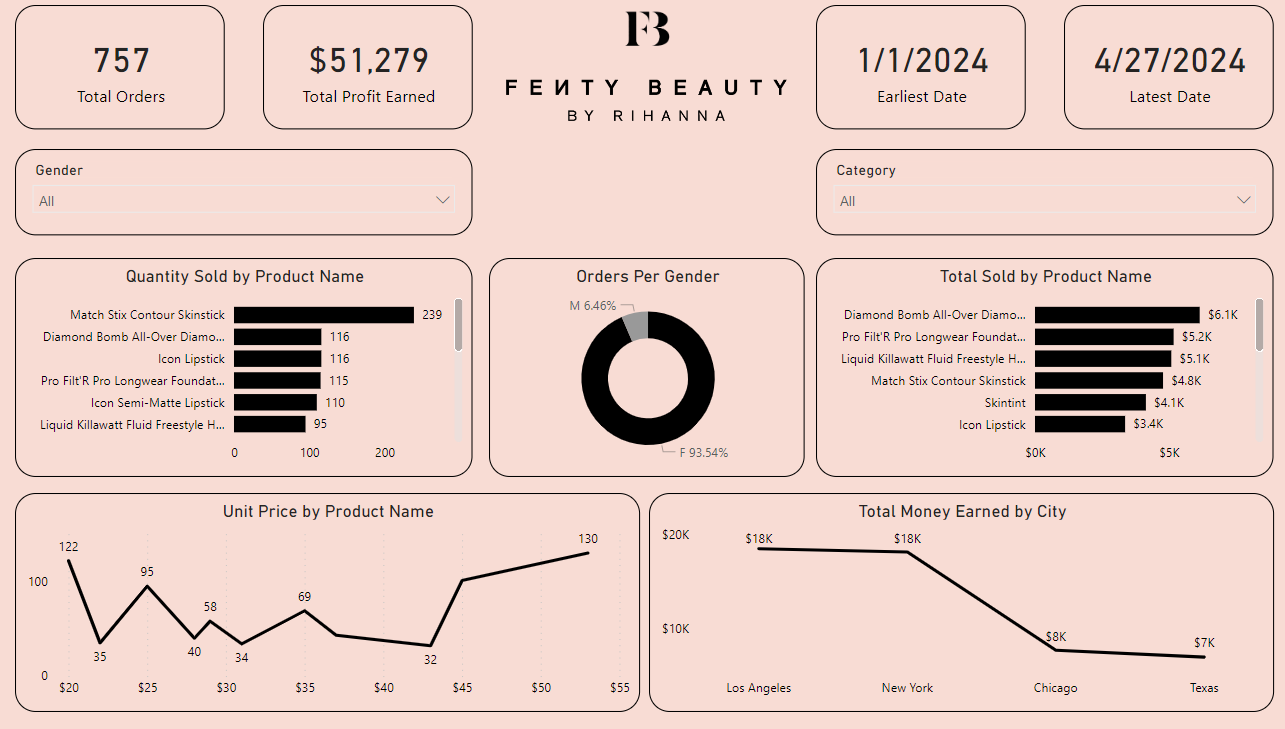
Displays total orders, profit, earliest and latest order dates, gender and category dropdown slicers, quantity sold, orders per gender, total sold, unit price by product name, and total money earned by city.
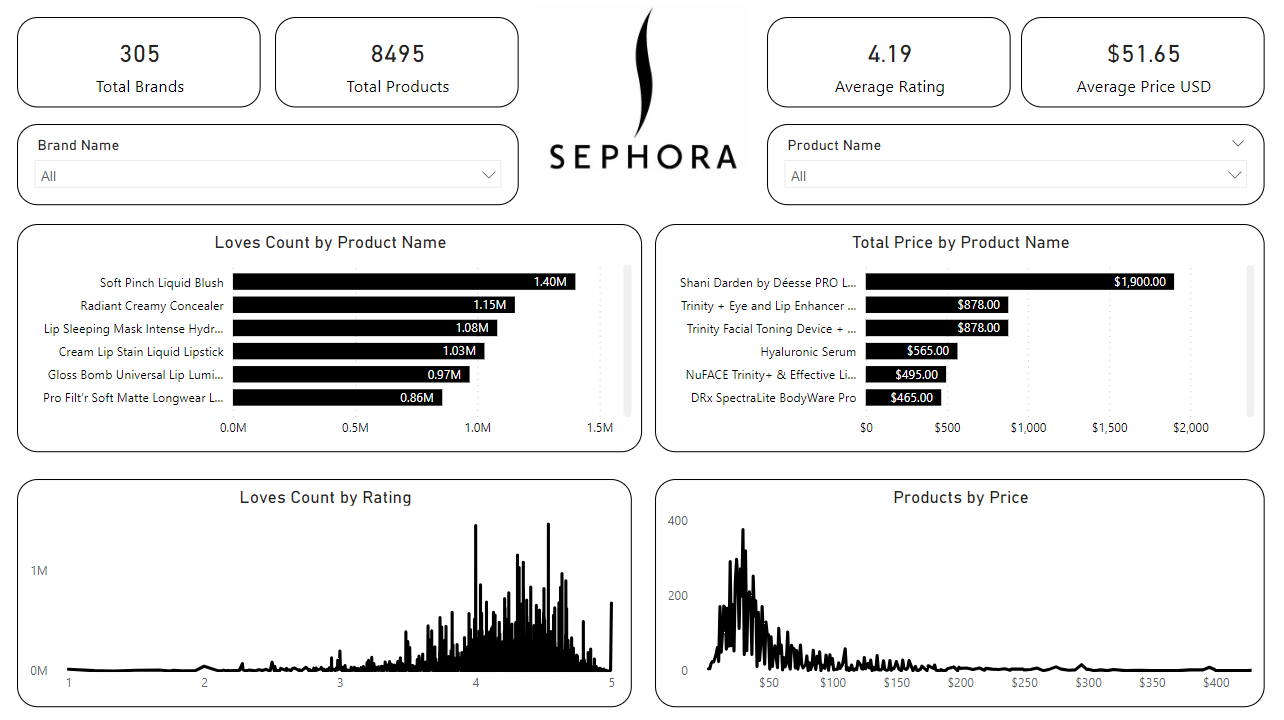
Shows total brands, products, average rating, price, brand and product name dropdown slicers, loves count, total price, love count by rating, and products by price.
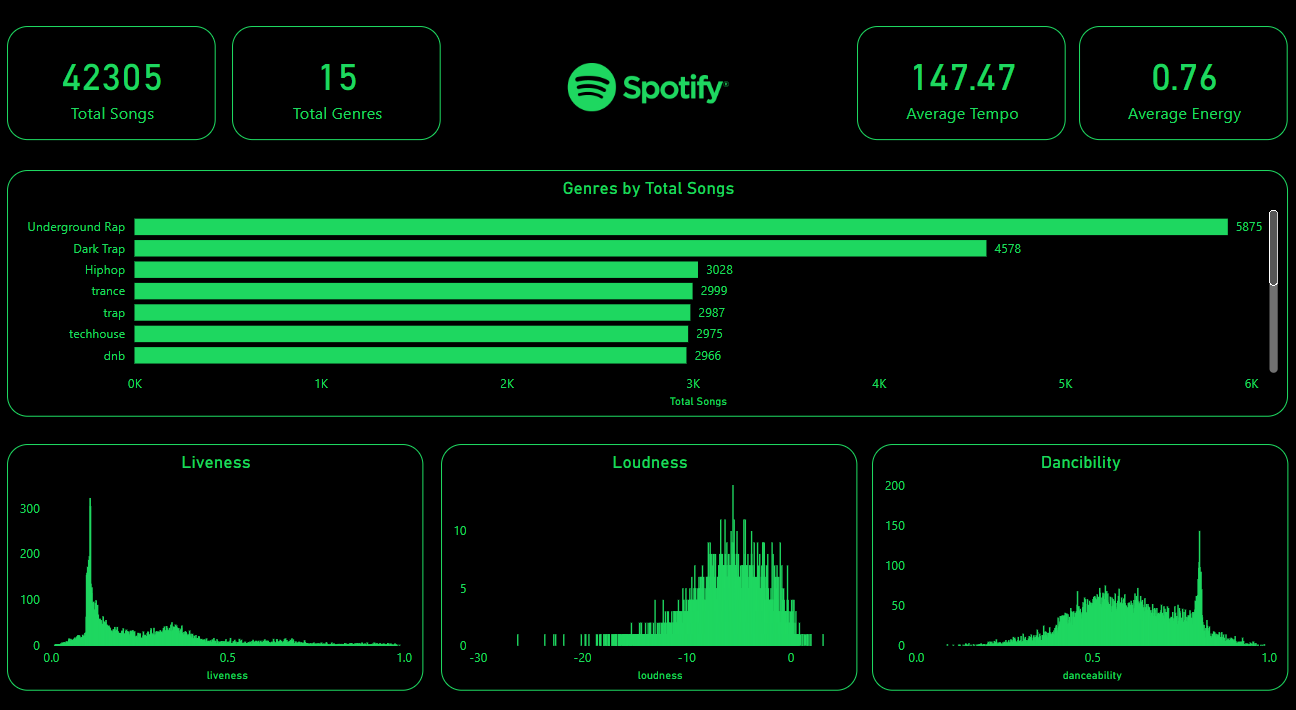
Displays total songs, genres, average tempo, energy, liveness, loudness, and danceability, with genres by total songs.
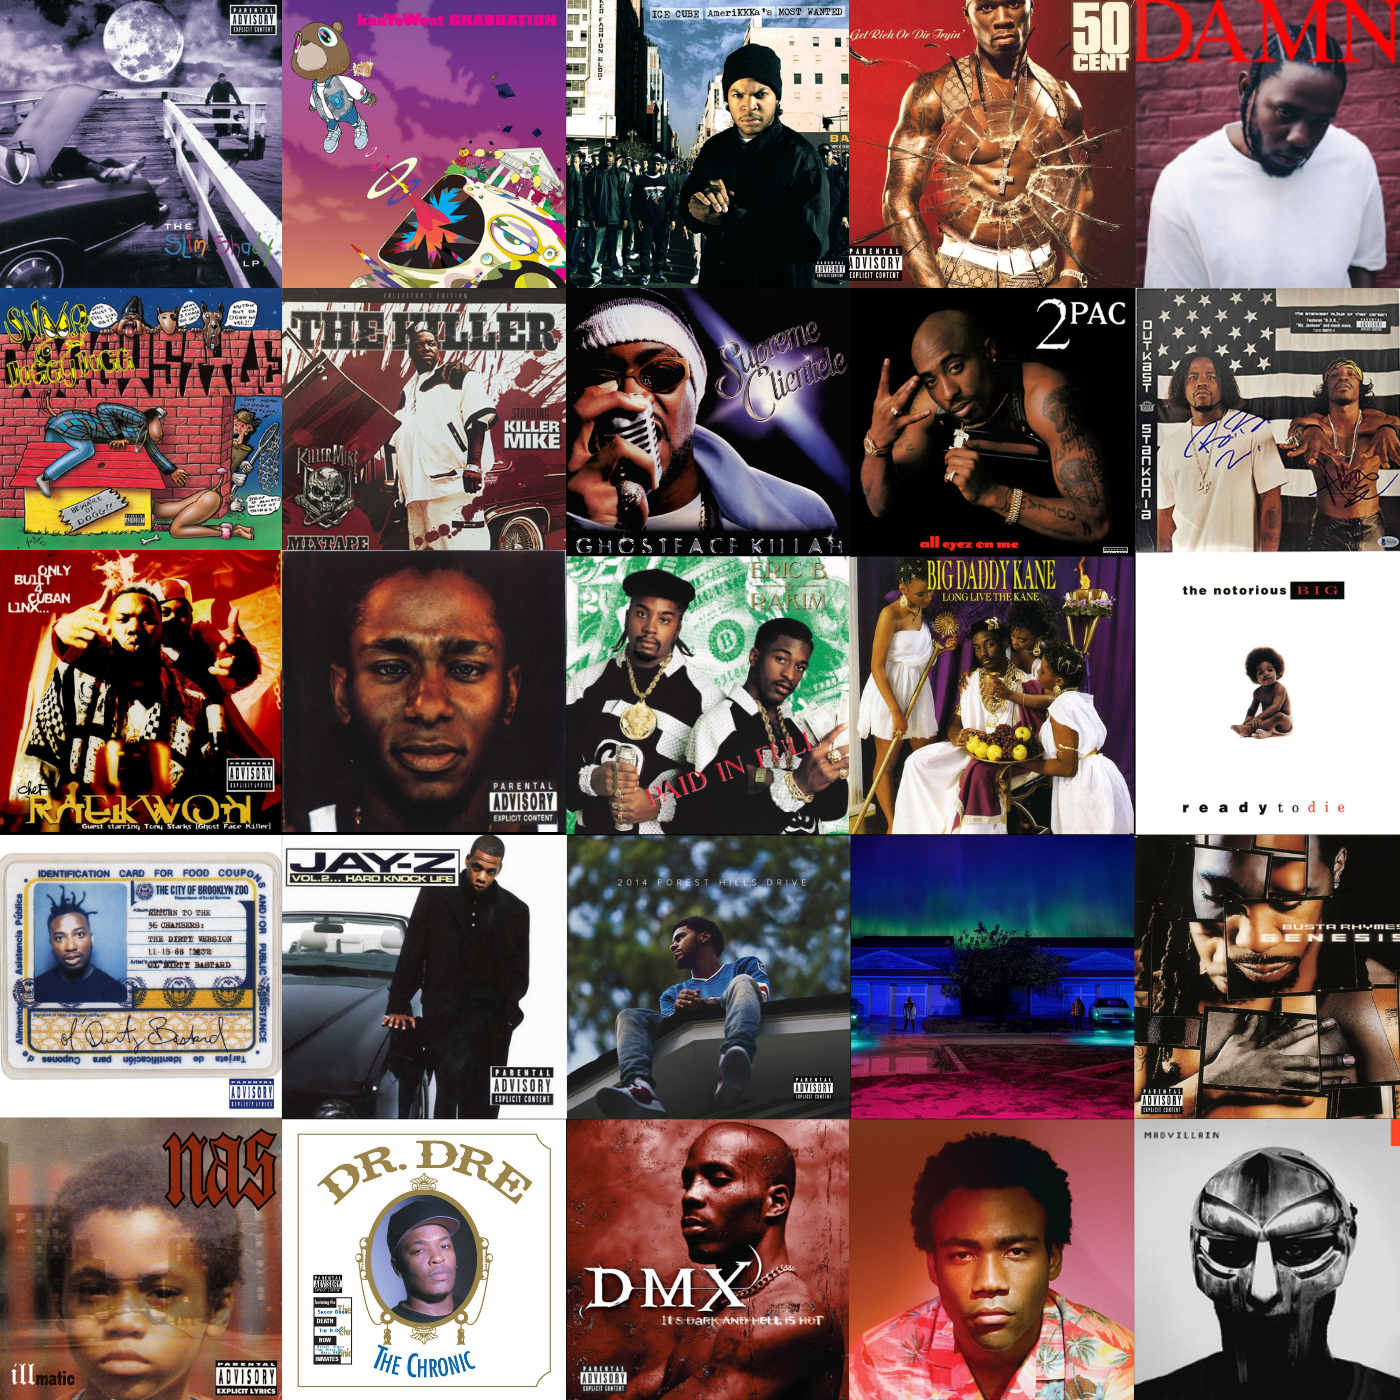
Visualizes total artists and tracks, earliest and latest year, artist, year, rank, and critic name slicer, gender, tracks by artists, and tracks by total critics graphs. It also features a collection of top rap albums I created in Canva.

During Rewriting The Code's 4th Annual Hackathon sponsored by Black Wings Hacks, our team the DEVAS created Nourish Net, an website for an online food relief network. Collaborated with Khanh Ha Nguyen, Martha Aponbiede, and Rubal Khehra to create a comprehensive website for a US Food Relief Network for College Students project using ReactJS, JavaScript, CSS, HTML, and Visual Studio Code. Designed and developed an intuitive platform aimed at addressing food insecurity among college students nationwide. Implemented features to facilitate volunteer engagement, donation drives, and access to food resources. Committed to leveraging technology to make a positive impact in the lives of students facing food insecurity.
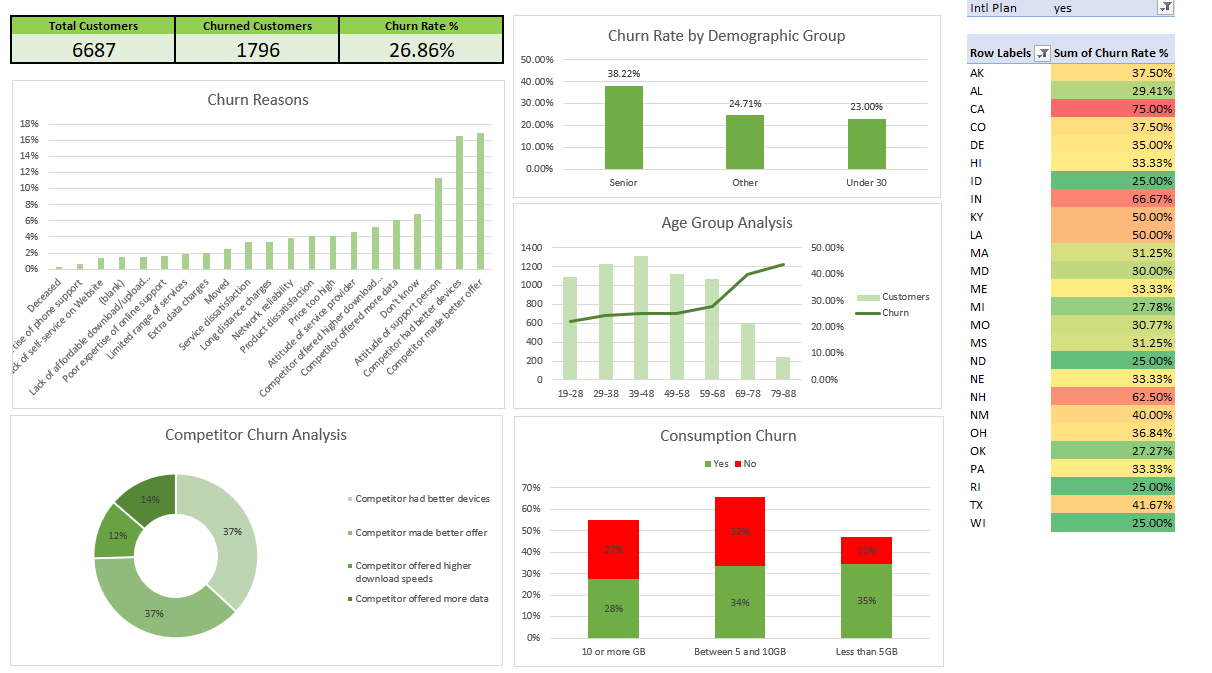
For subscription-based businesses, reducing customer churn is a top priority. In this Excel case study, you'll investigate a dataset from an example telecom company Databel and analyze their churn rates. Analyzing churn doesn’t just mean knowing the churn rate: it’s also about figuring out why customers are churning at the rate they are and how to reduce churn. You'll answer these questions by creating calculated columns and fields, building PivotTables, and creating an eye-catching dashboard.
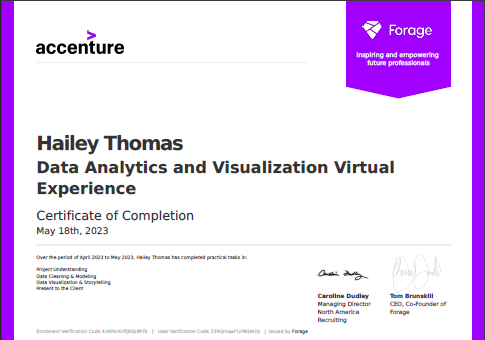
Here is a certification I earned from Forage, an online certification-earning service that allows students to learn technical and soft skills to prepare them to get hired. The certification I earned was offered by Accenture.
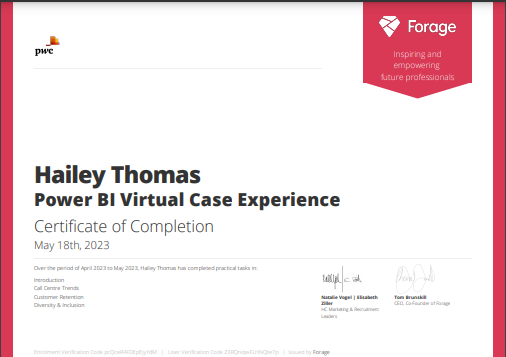
Here is a certification I earned from Forage, an online certification-earning service that allows students to learn technical and soft skills to prepare them to get hired. The certification I earned was offered by PwC Switzerland.
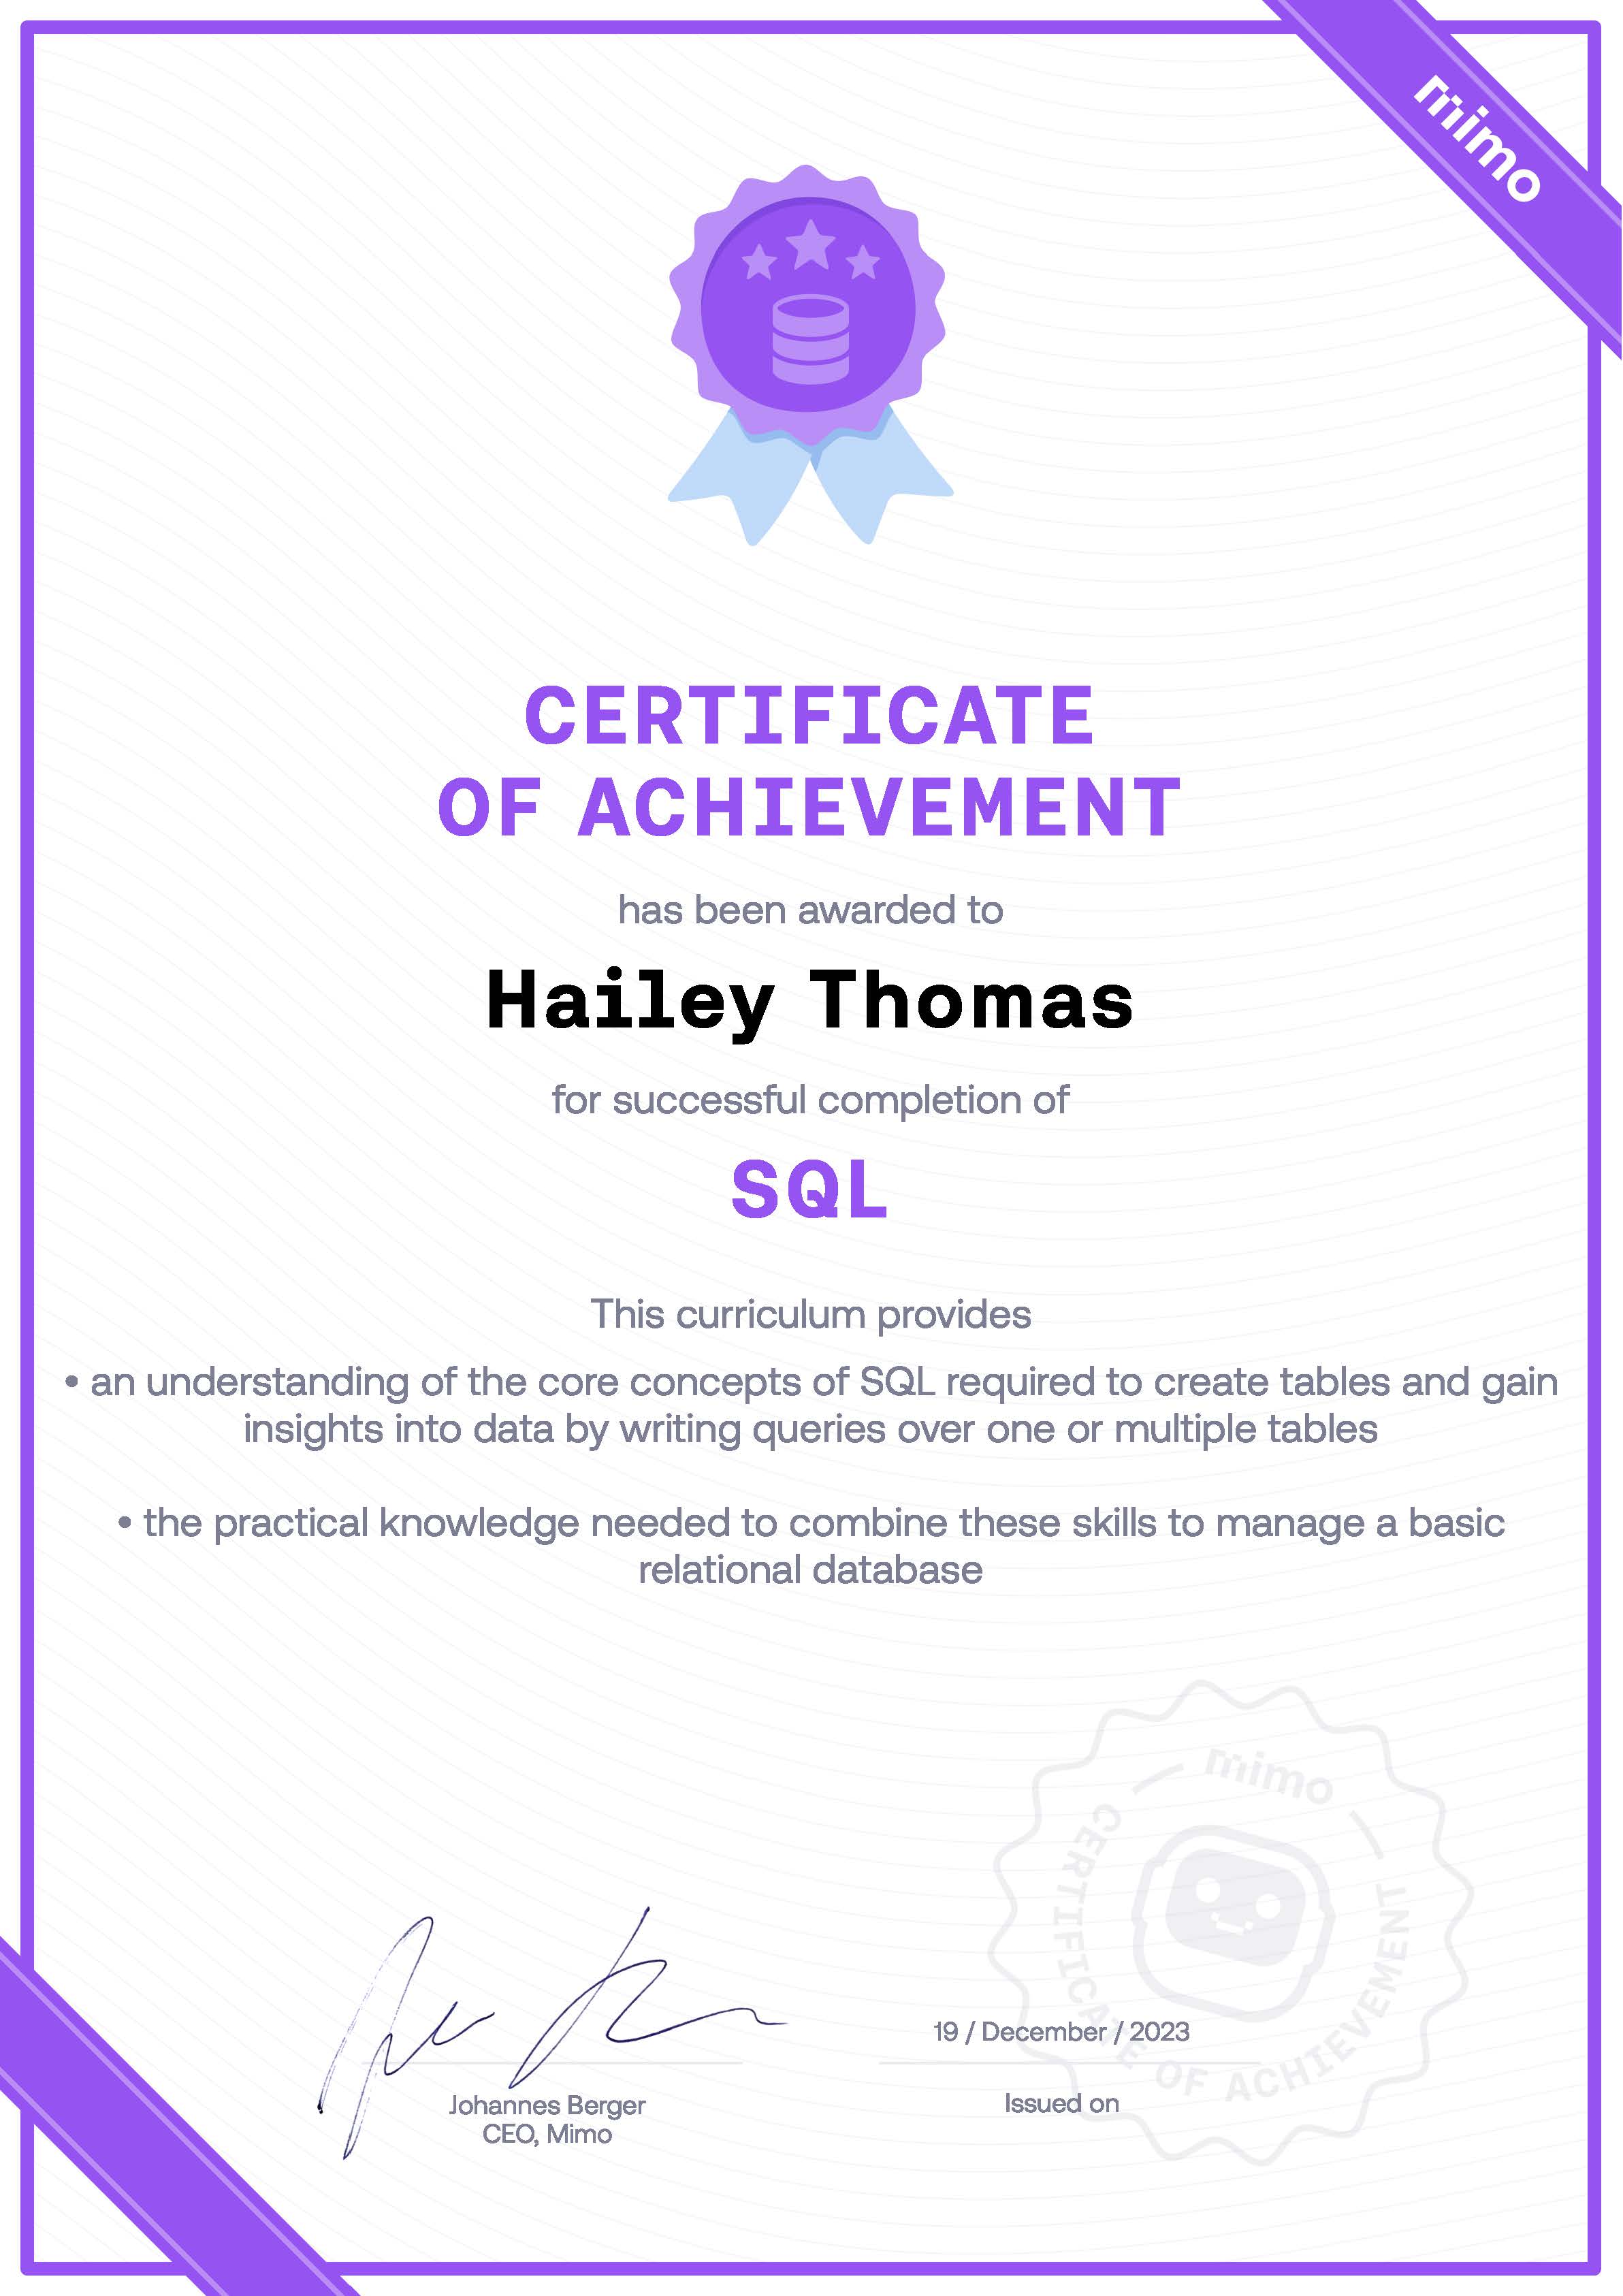
Here is a certification I earned from Mimo. Mimo is a programming app for learning to code quickly! Mimo makes learning to code and diving into computer science intuitive and easy. Experts built our curriculum to help you learn and work on real-world projects in HTML, JavaScript, CSS, Python, and SQL.
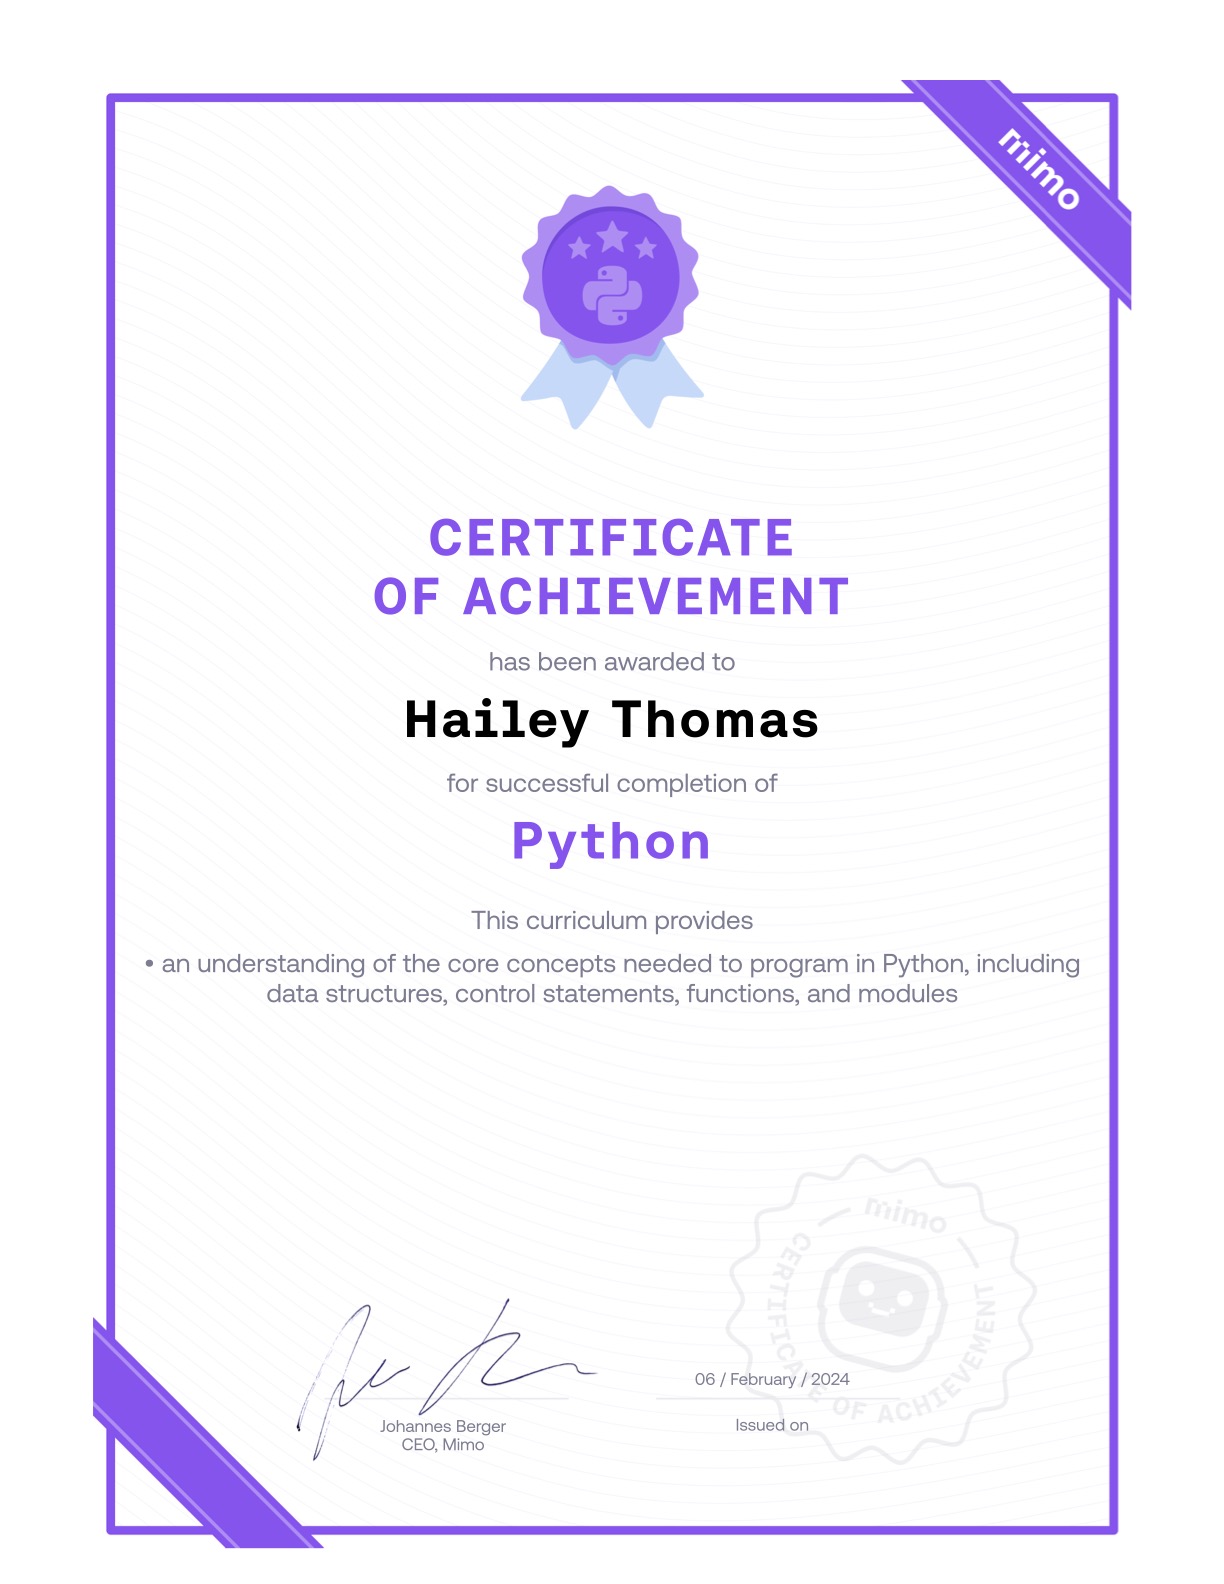
Here is a certification I earned from Mimo. Mimo is a programming app for learning to code quickly! Mimo makes learning to code and diving into computer science intuitive and easy. Experts built our curriculum to help you learn and work on real-world projects in HTML, JavaScript, CSS, Python, and SQL.
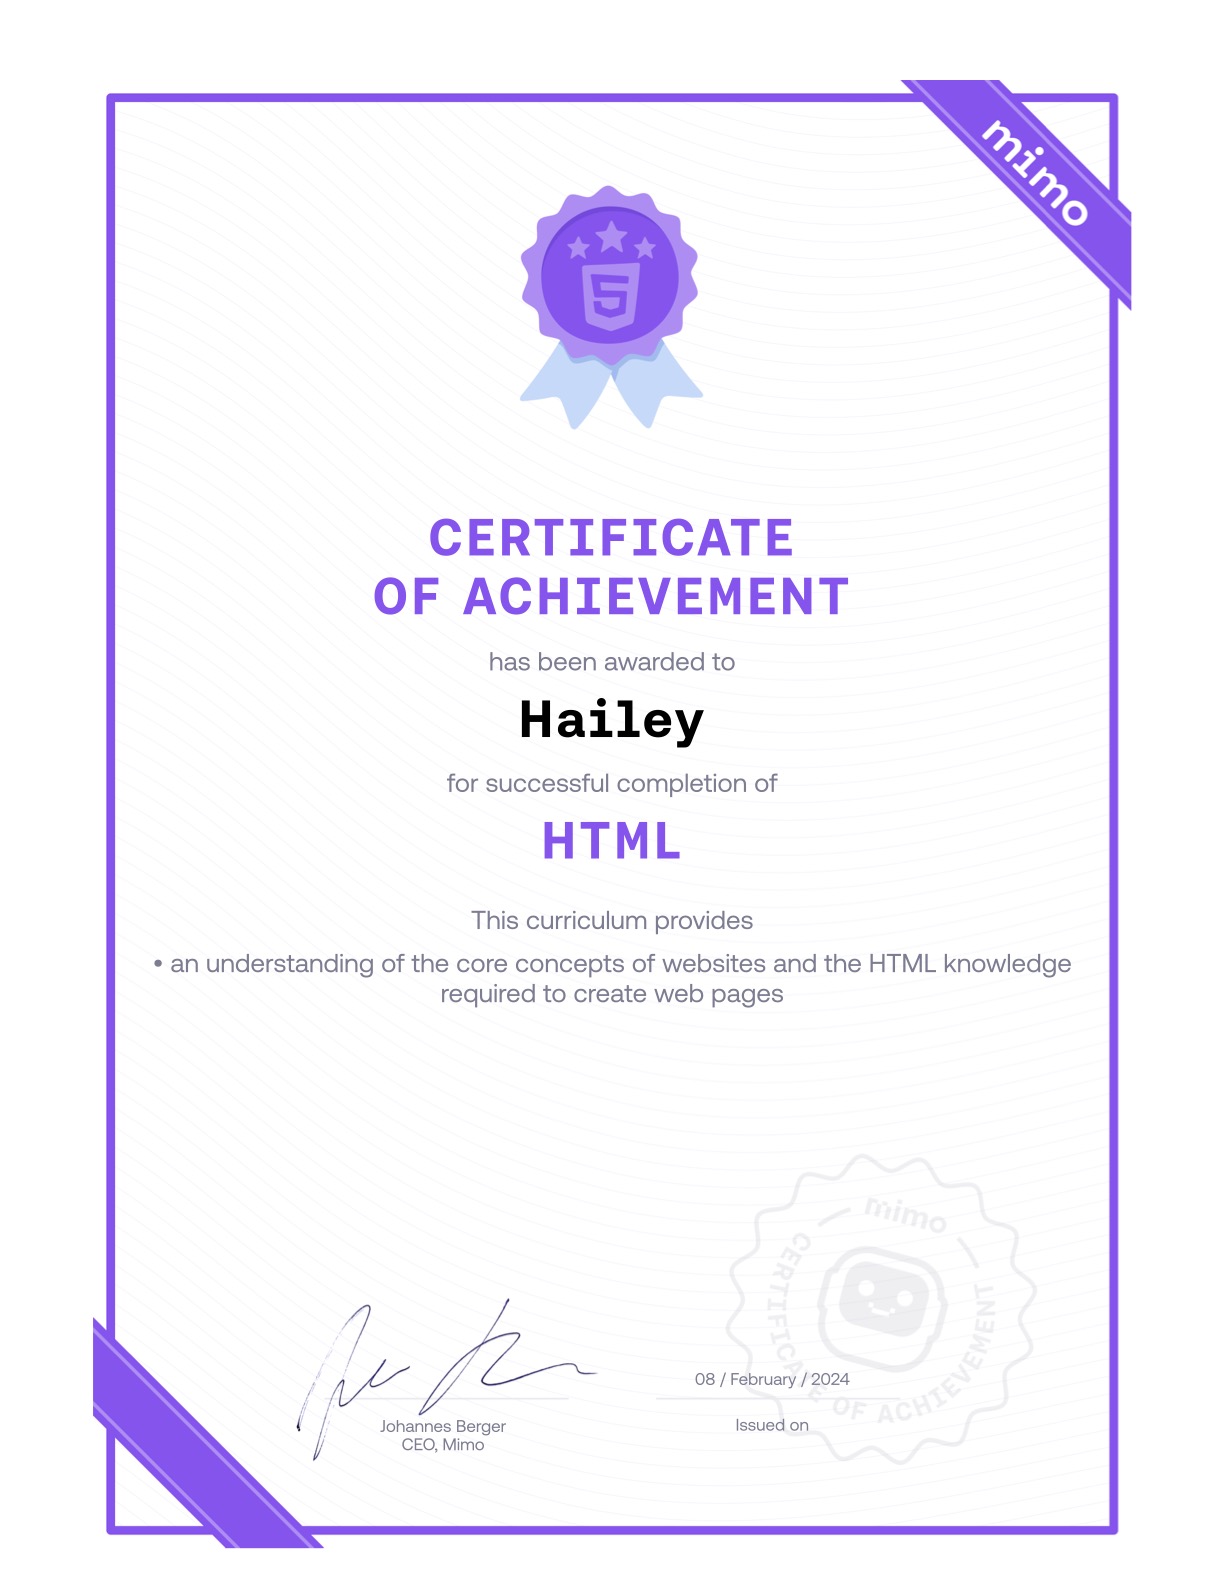
Here is a certification I earned from Mimo. Mimo is a programming app for learning to code quickly! Mimo makes learning to code and diving into computer science intuitive and easy. Experts built our curriculum to help you learn and work on real-world projects in HTML, JavaScript, CSS, Python, and SQL.
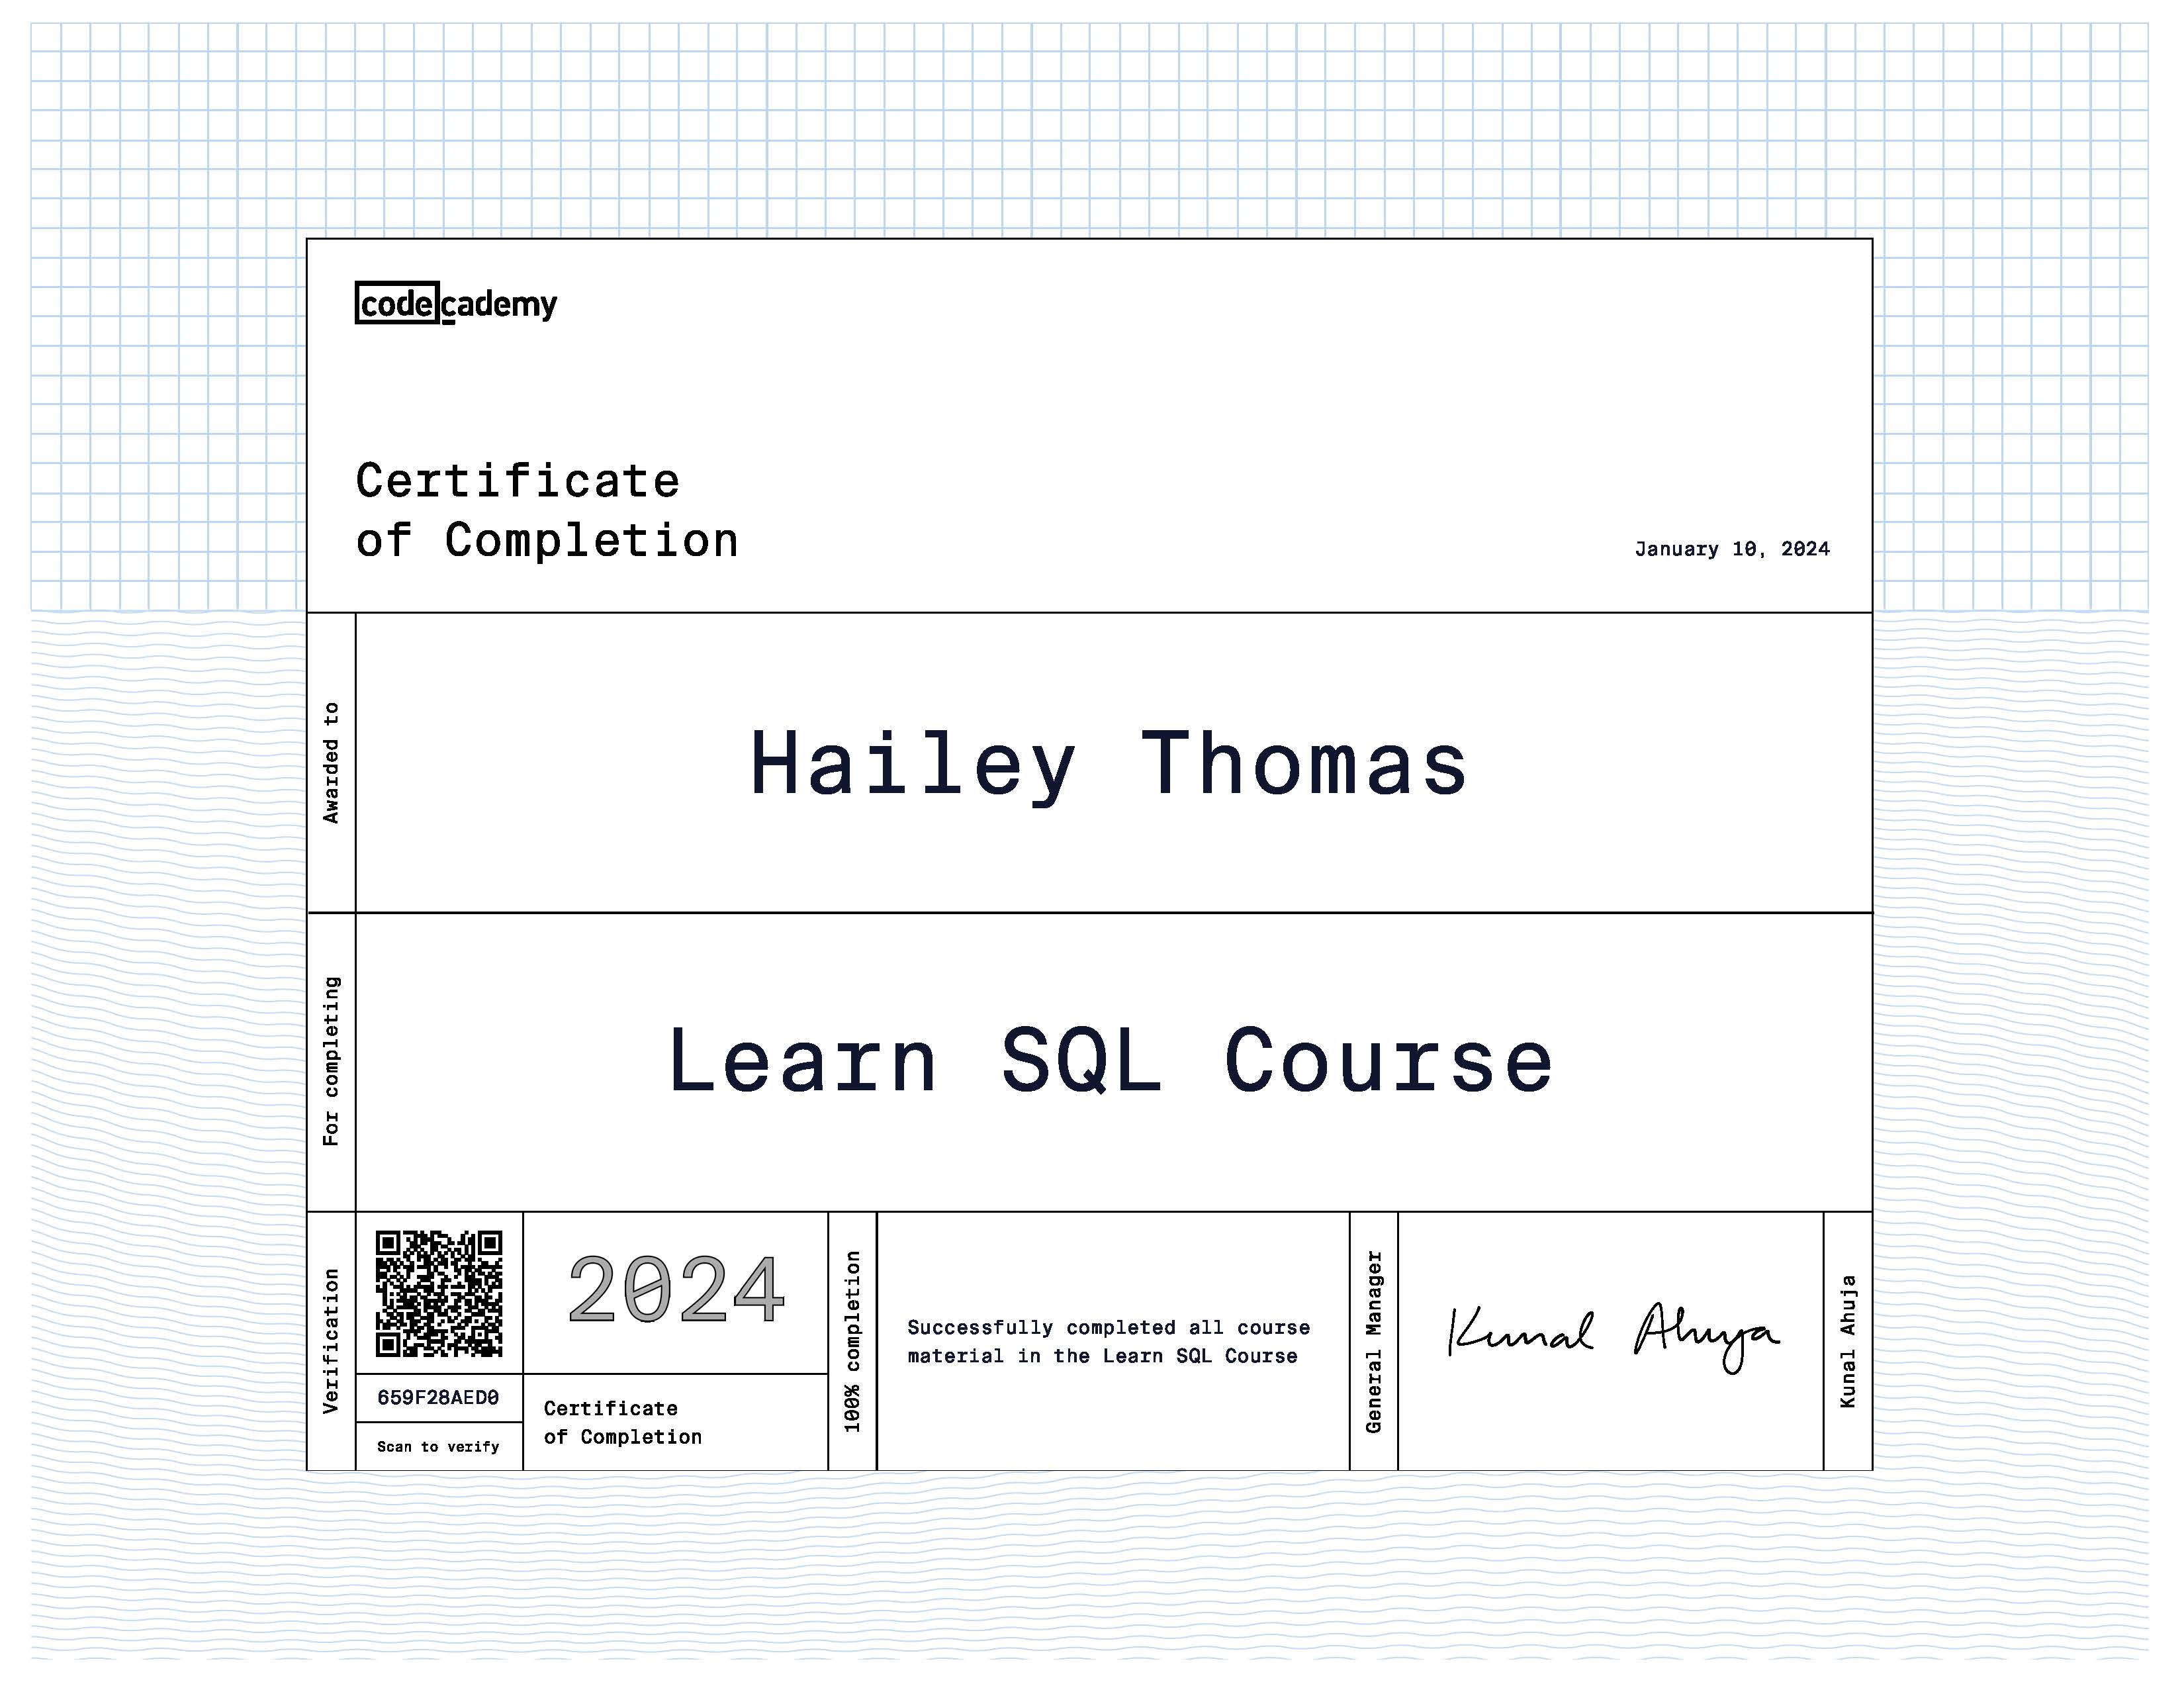
Here is a certification I earned from Codeacademy. In this SQL course, I learned how to manage large datasets and analyzed real data using the standard data management language.
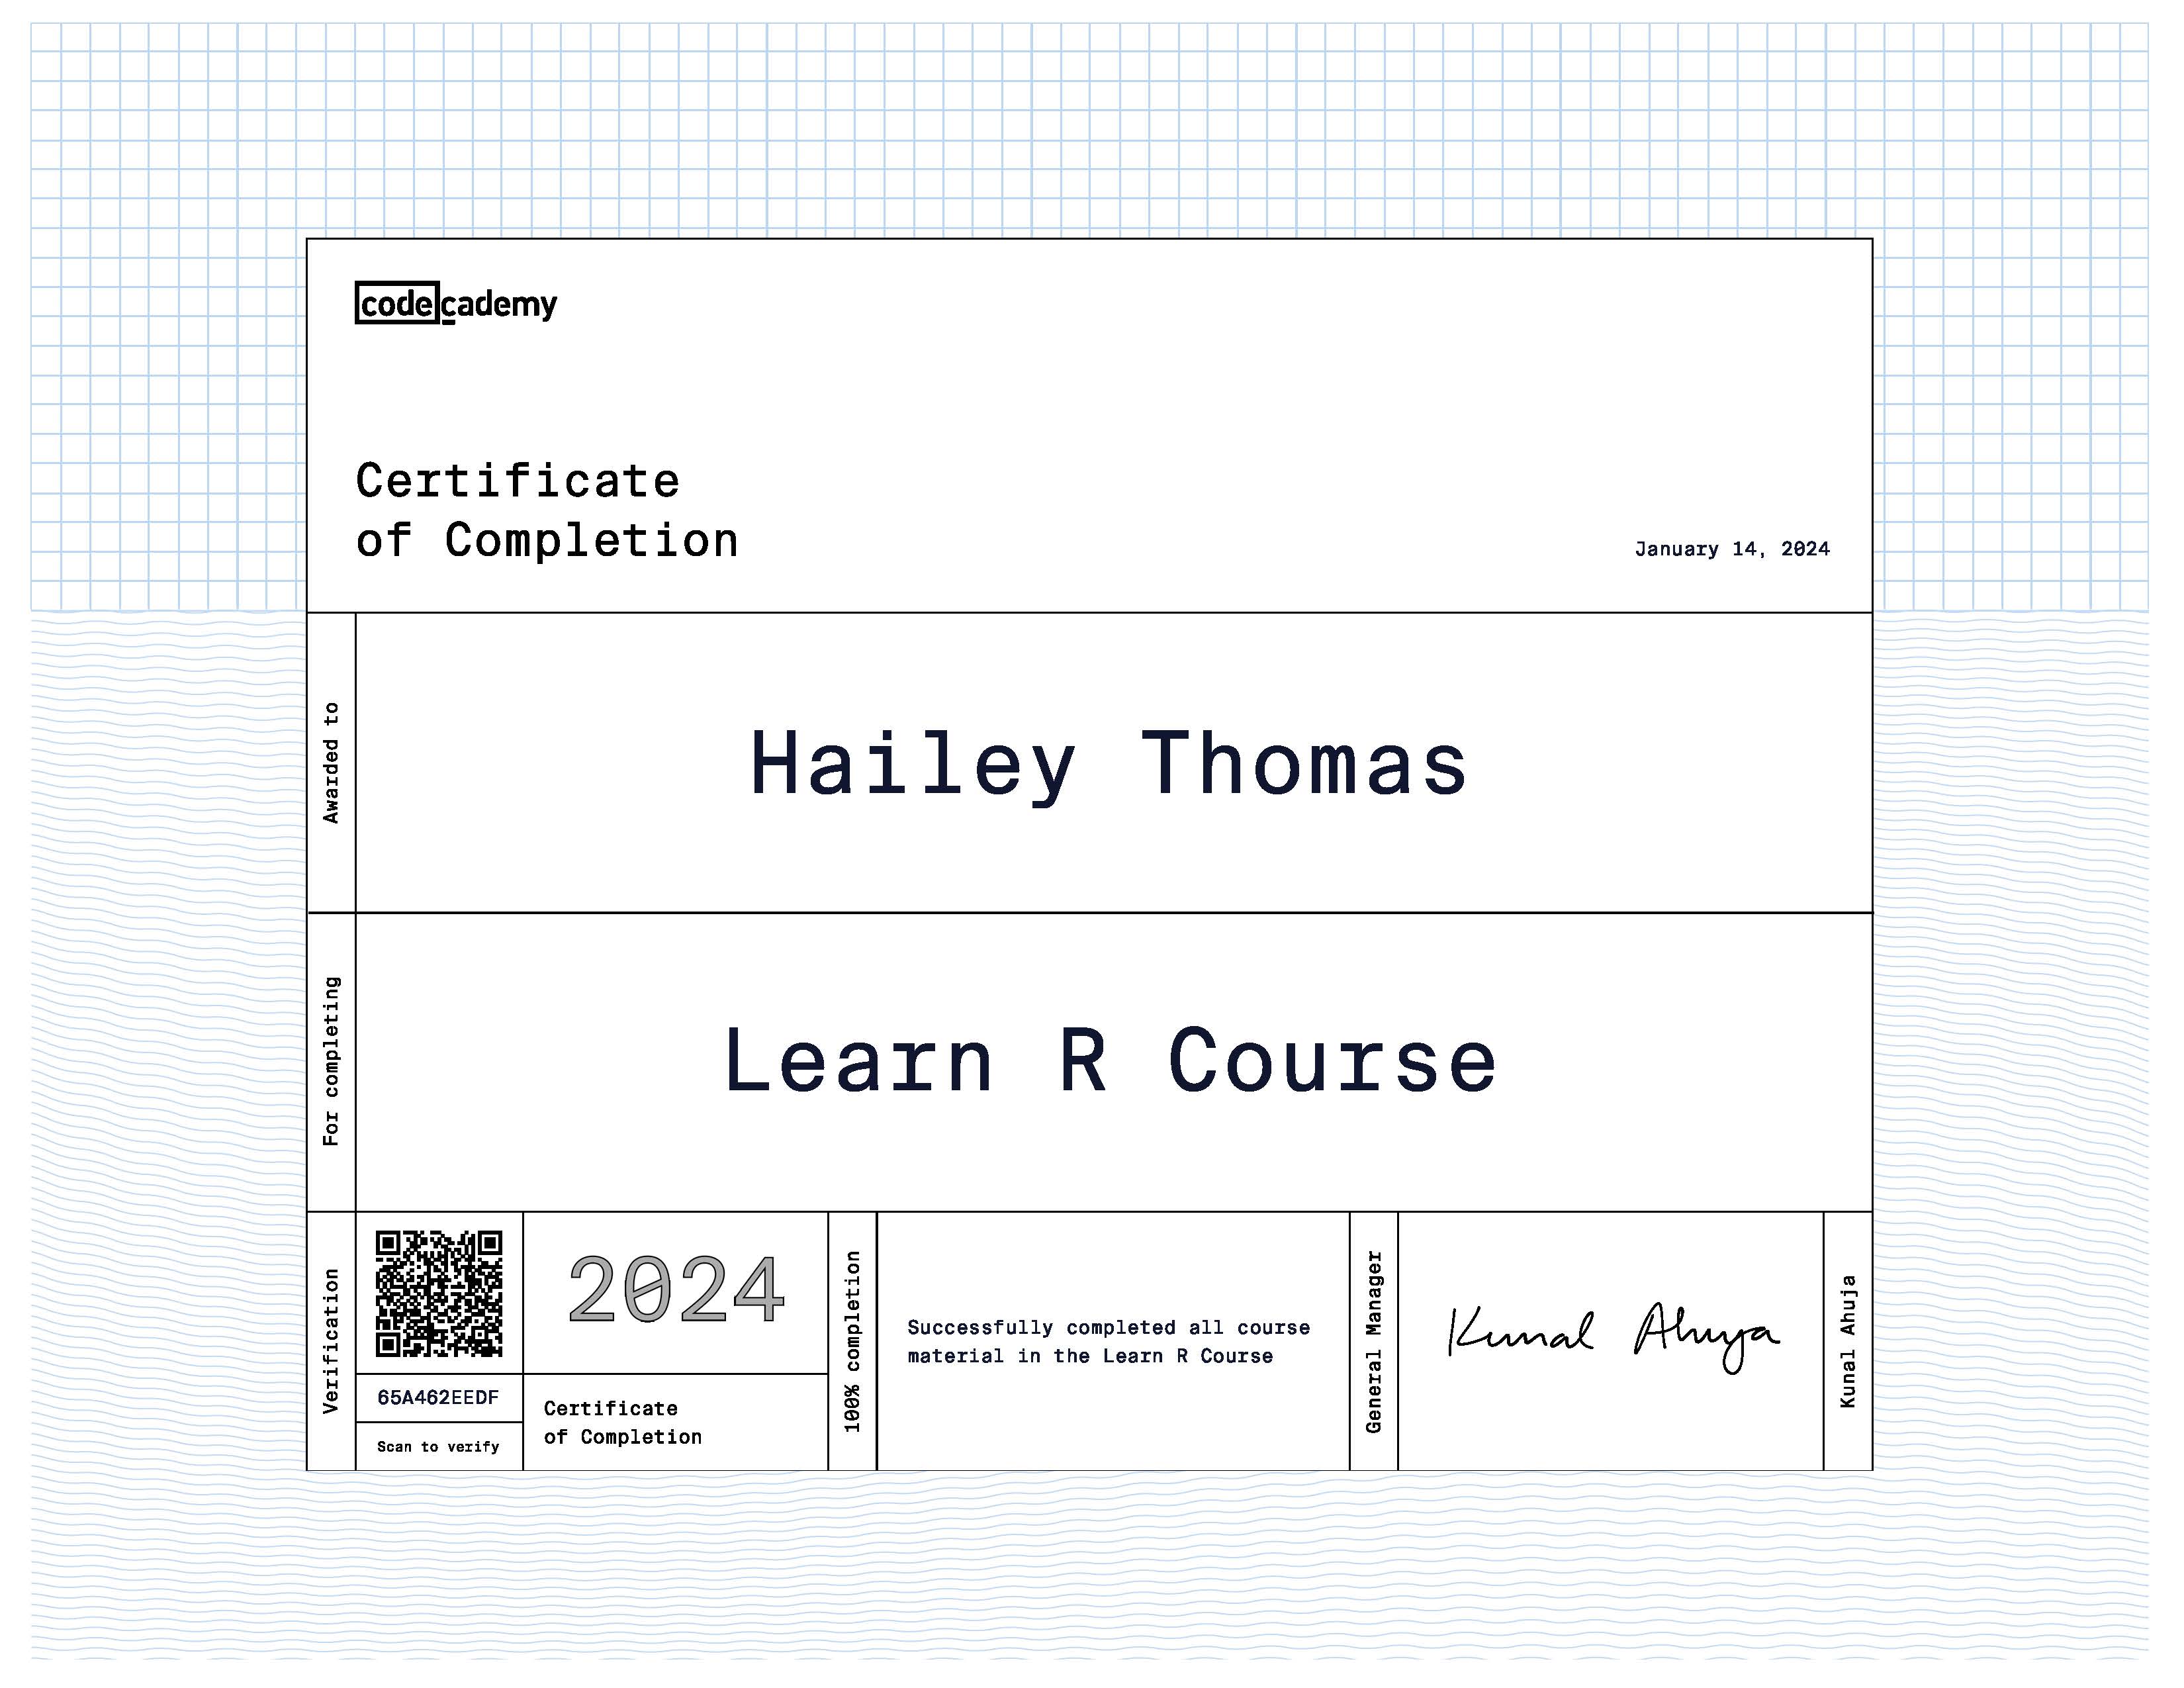
Here is a certification I earned from Codeacademy. I learned how to code, clean, and manipulate data for analysis and visualization with the R programming language in this R course.
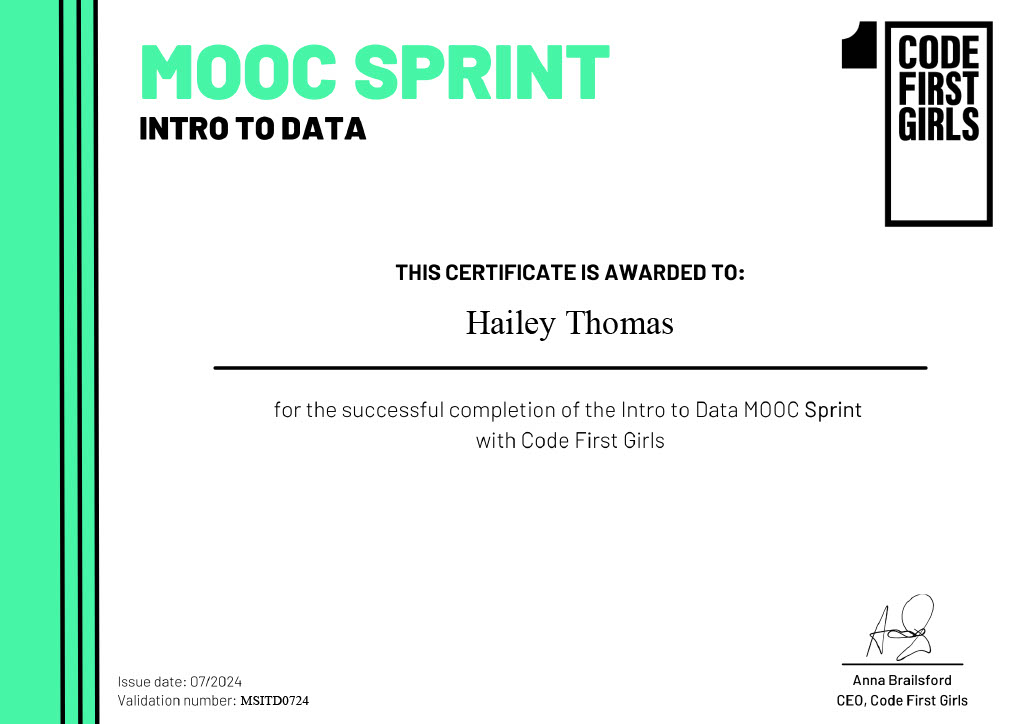
Here is a certification I earned from Code First Girls. In this SQL course, I learned simple SQL, the importance of data visualization and interpretation, and how to write SQL queries.
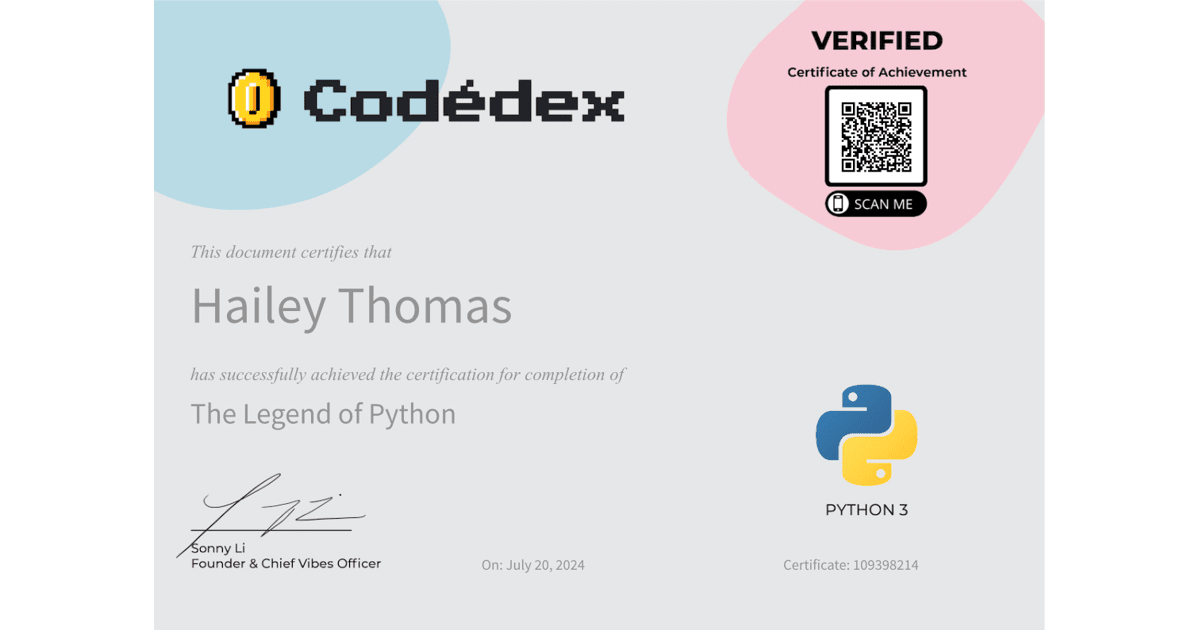
Here is a certification I earned from Codédex. I learned simple Python in this Python course, practiced writing code on their IDE and Visual Studio Code, and worked on projects and coursework.
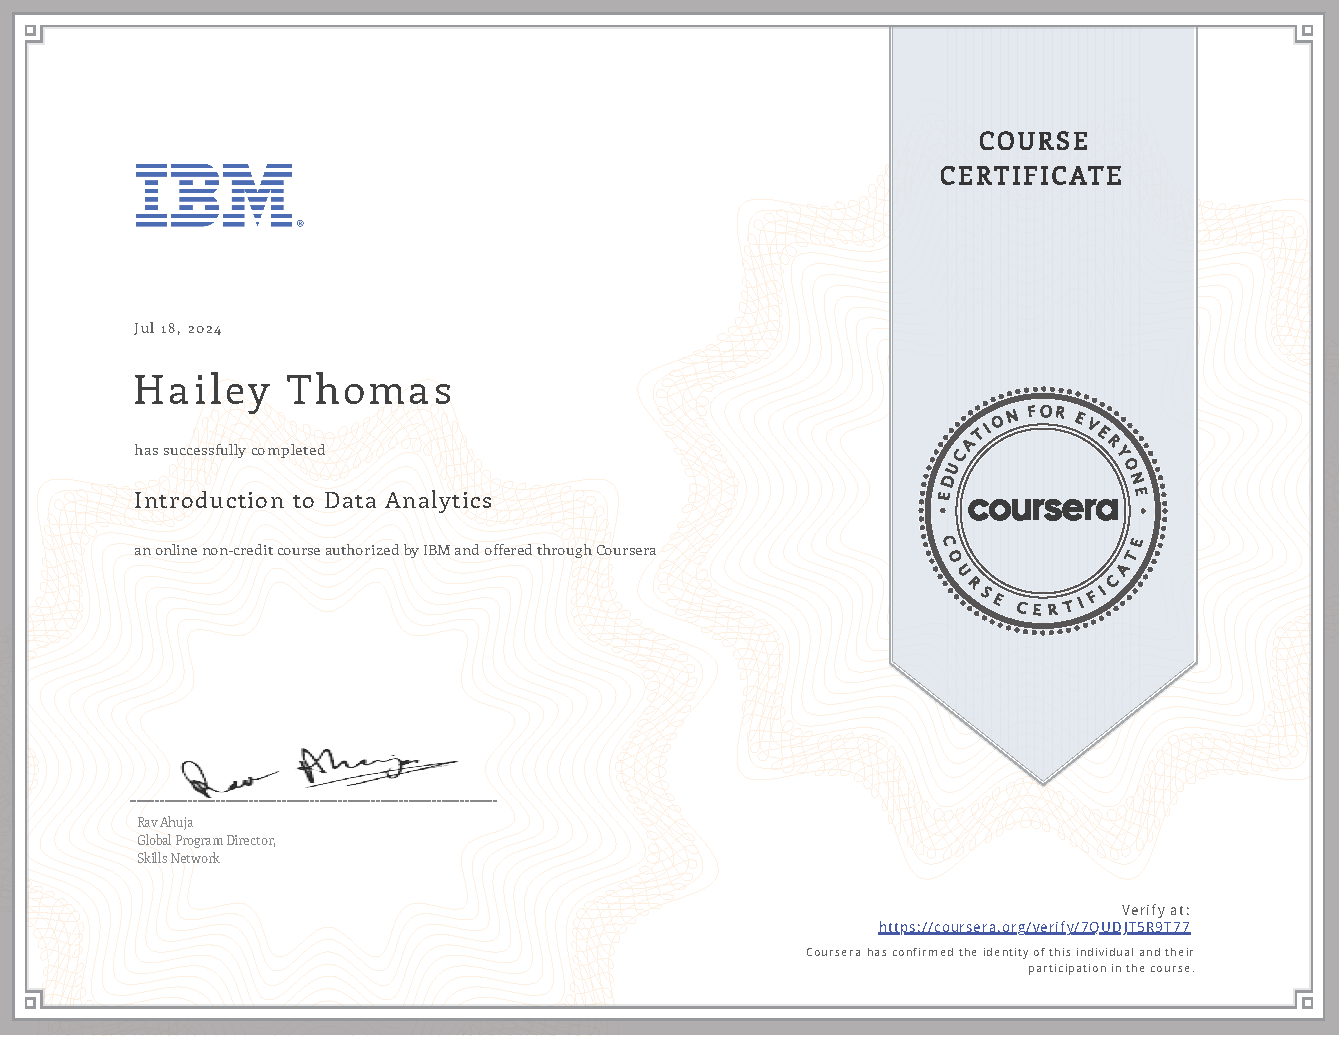
Here is a certification I earned from Coursera during the summer of 2024. In this course, I learned more about the basis of data analysis, the data lifestyle, and the data processes, worked on projects, and coursework.
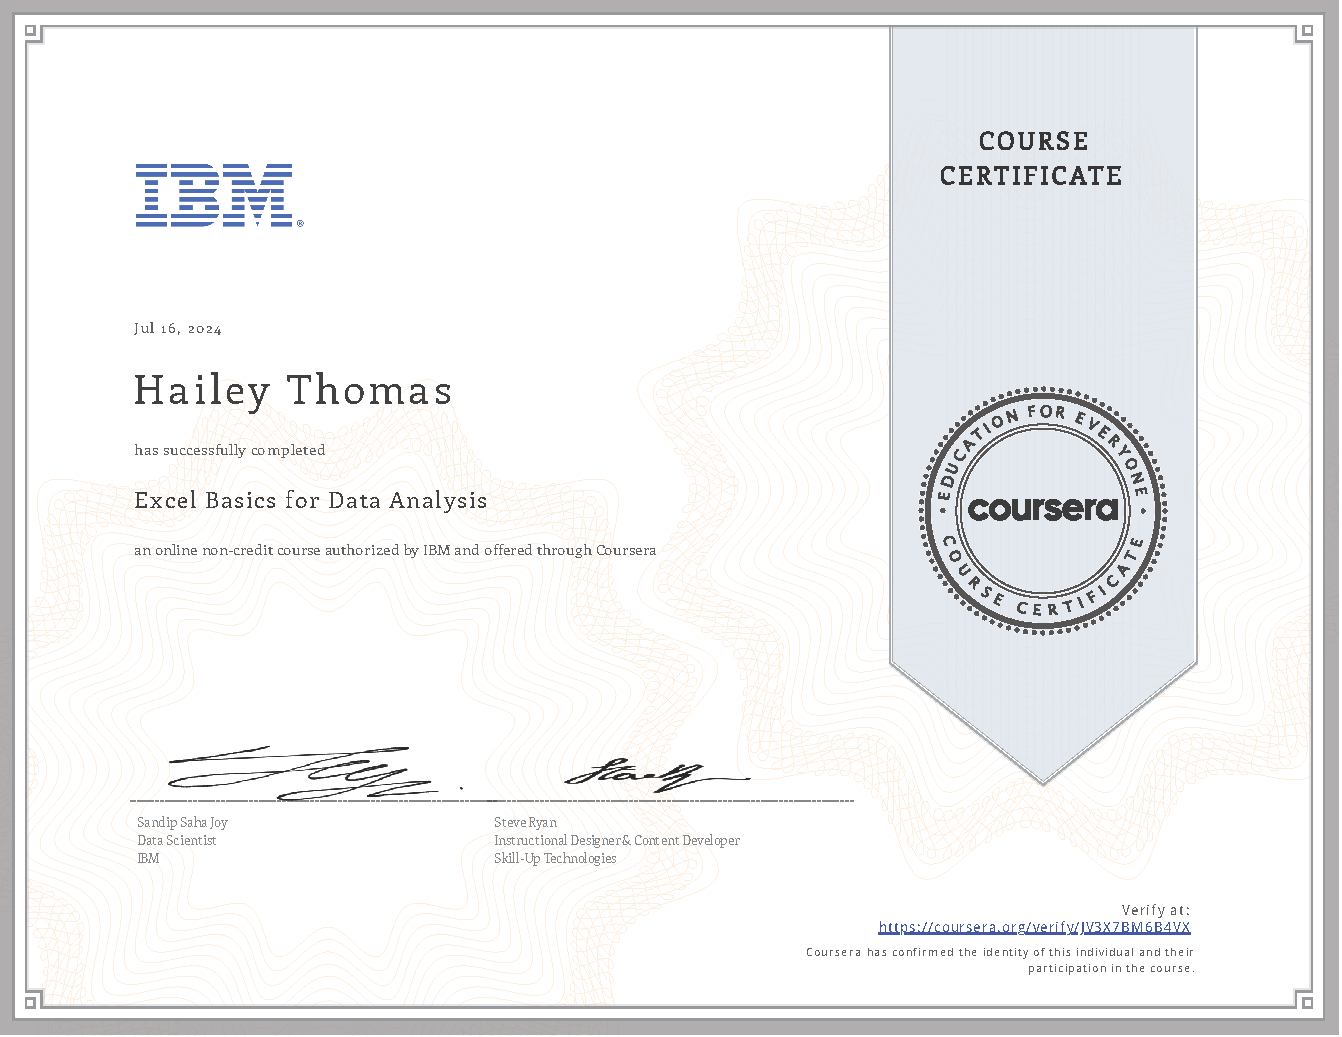
Here is a certification I earned from Coursera during the summer of 2024. In this Excel course, I learned simple how use functions, how to perform data analysis with Excel, pivot tables, the different visuals, how to make dashboards with Excel, worked on projects, and coursework.
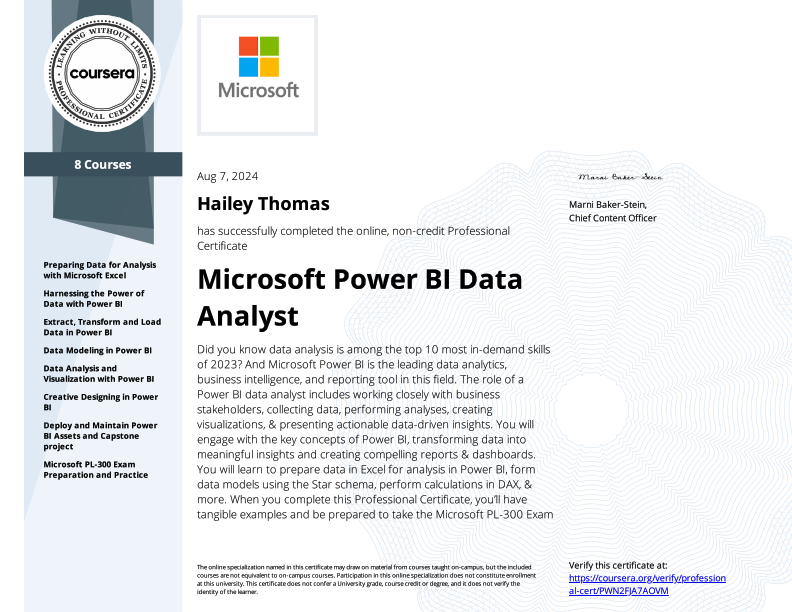
The Microsoft Power BI Data Analyst Coursera Certificate provides learners with comprehensive skills in using Power BI for data analysis and visualization. The course covers essential topics such as data preparation, model building, data visualization, and dashboard creation. By completing this certification, students gain practical experience and become proficient in creating insightful reports and dashboards, enabling them to make data-driven decisions effectively.
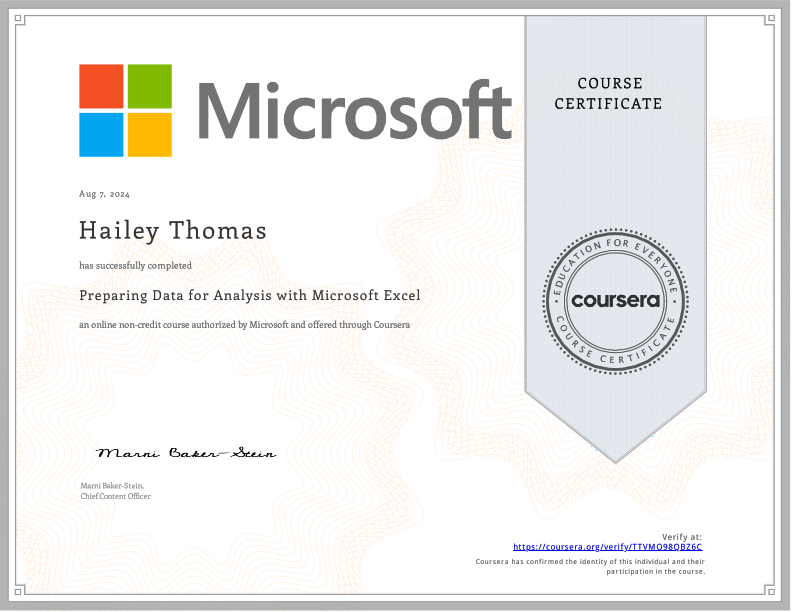
Here is a certification I earned from Coursera during the summer of 2024. Part of the Microsoft Data Analyst Power BI specialization, this course teaches essential Excel skills to clean, organize, and prepare data for analysis, making it ready for advanced data visualization and reporting.
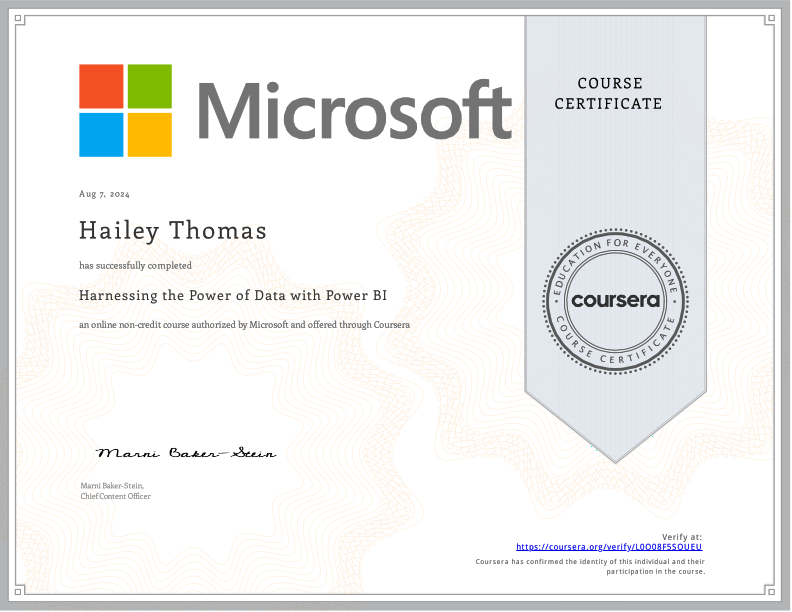
Here is a certification I earned from Coursera during the summer of 2024. Part of the Microsoft Data Analyst Power BI specialization, this course helped me discover how to leverage Power BI to transform raw data into insightful visualizations and interactive dashboards that drive business decisions.
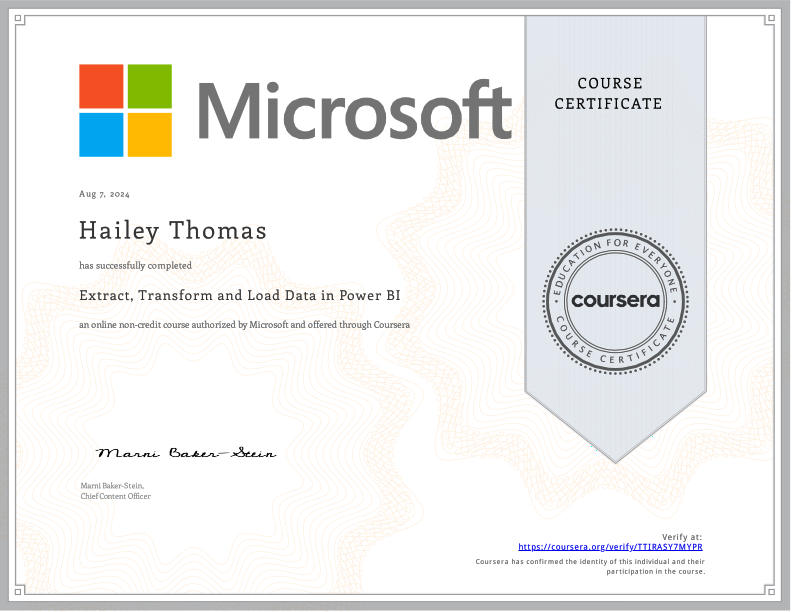
Here is a certification I earned from Coursera during the summer of 2024. Part of the Microsoft Data Analyst Power BI specialization, this course covers mastering the ETL process in Power BI, including importing data from various sources, transforming it, and loading it into my data models for analysis.
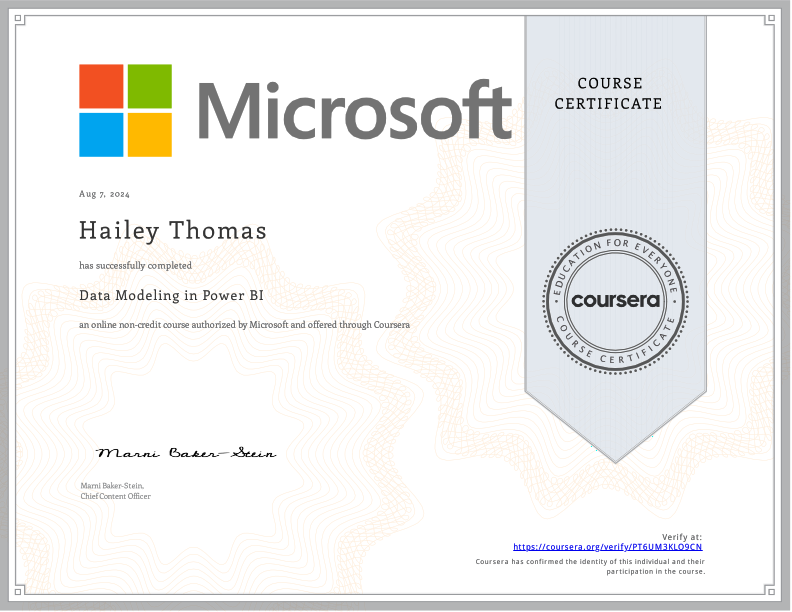
Here is a certification I earned from Coursera during the summer of 2024. Part of the Microsoft Data Analyst Power BI specialization, this course provides expertise in creating and managing data models in Power BI, enabling you to structure my data efficiently for accurate and meaningful analysis.
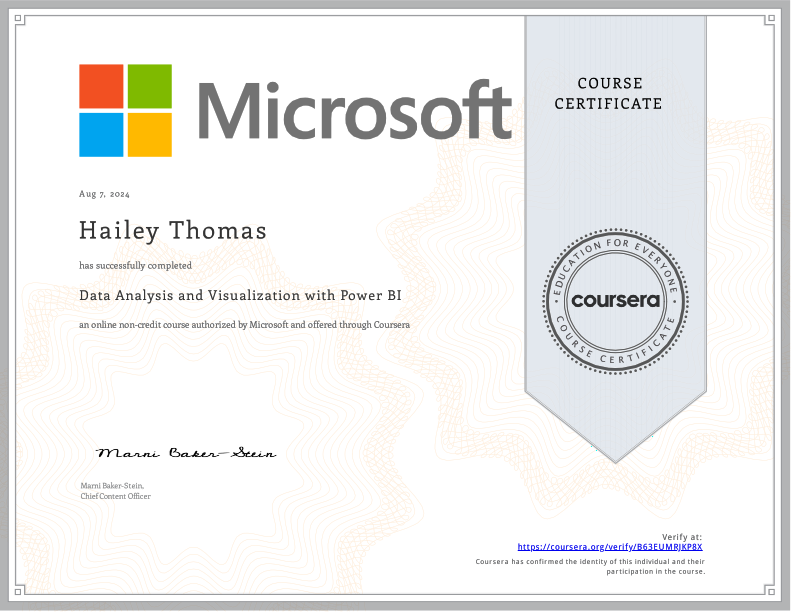
Here is a certification I earned from Coursera during the summer of 2024. Part of the Microsoft Data Analyst Power BI specialization, this course develops your skills in analyzing data and creating compelling visualizations using Power BI's advanced tools and features to convey insights effectively.
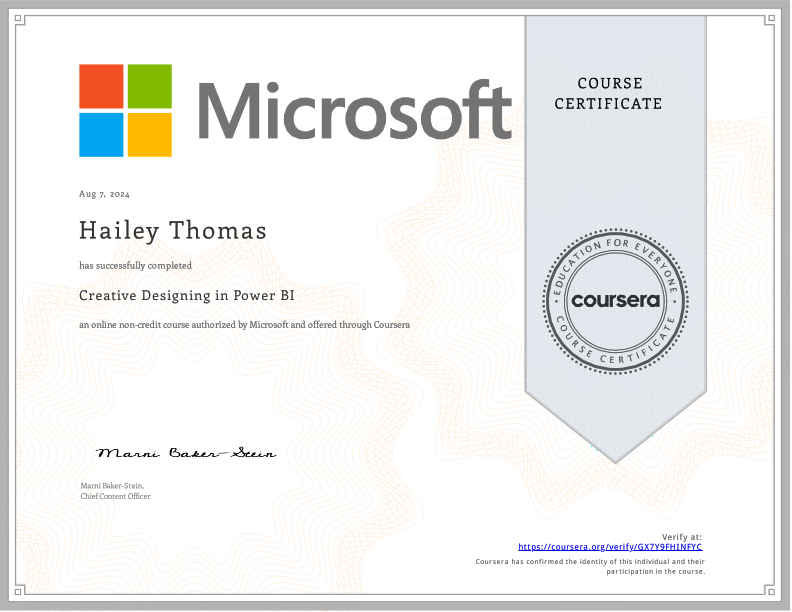
Here is a certification I earned from Coursera during the summer of 2024. Part of the Microsoft Data Analyst Power BI specialization, this course explores creative design techniques in Power BI to build visually appealing and user-friendly reports and dashboards that captivate my audience.
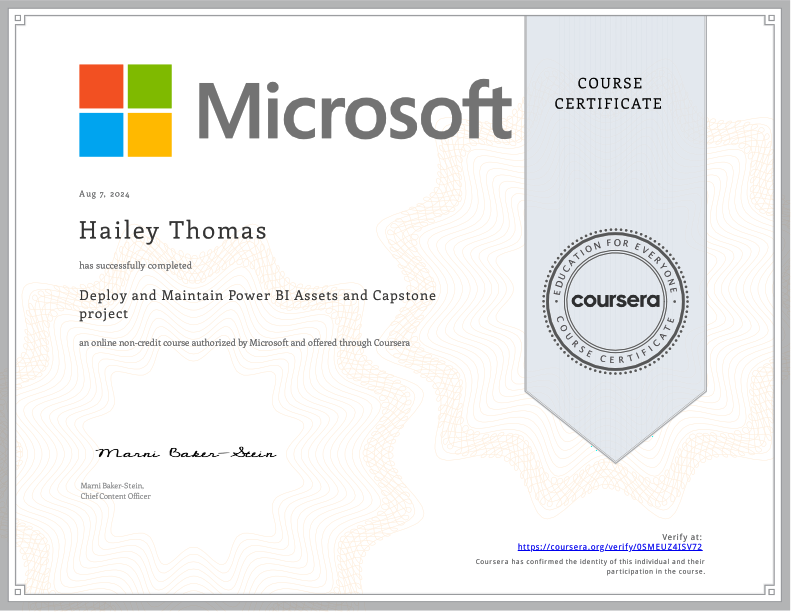
Here is a certification I earned from Coursera during the summer of 2024. Part of the Microsoft Data Analyst Power BI specialization, this course teaches best practices for deploying and maintaining Power BI reports and dashboards, culminating in a capstone project that showcases my skills.
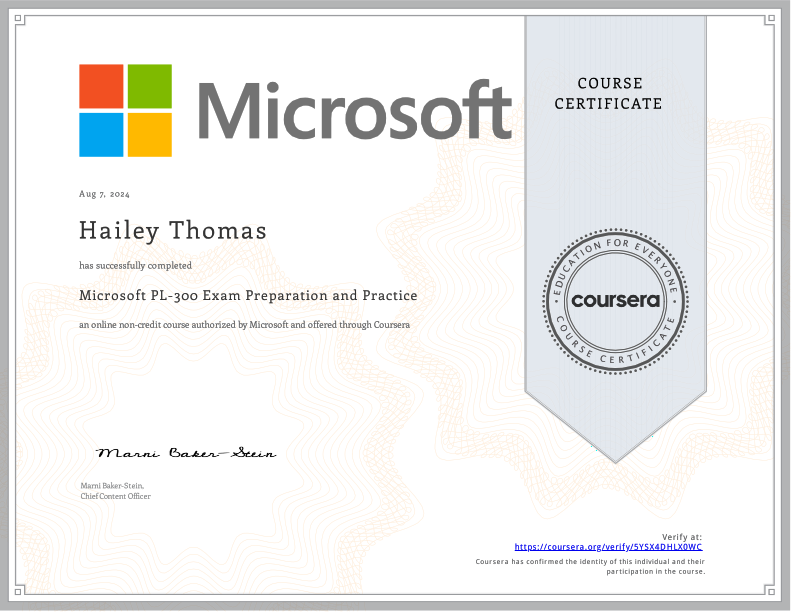
Here is a certification I earned from Coursera during the summer of 2024. Part of the Microsoft Data Analyst Power BI specialization, this course prepared me for the Microsoft PL-300 exam with focused study materials and practice exercises designed to ensure I pass and achieve my Power BI certification.
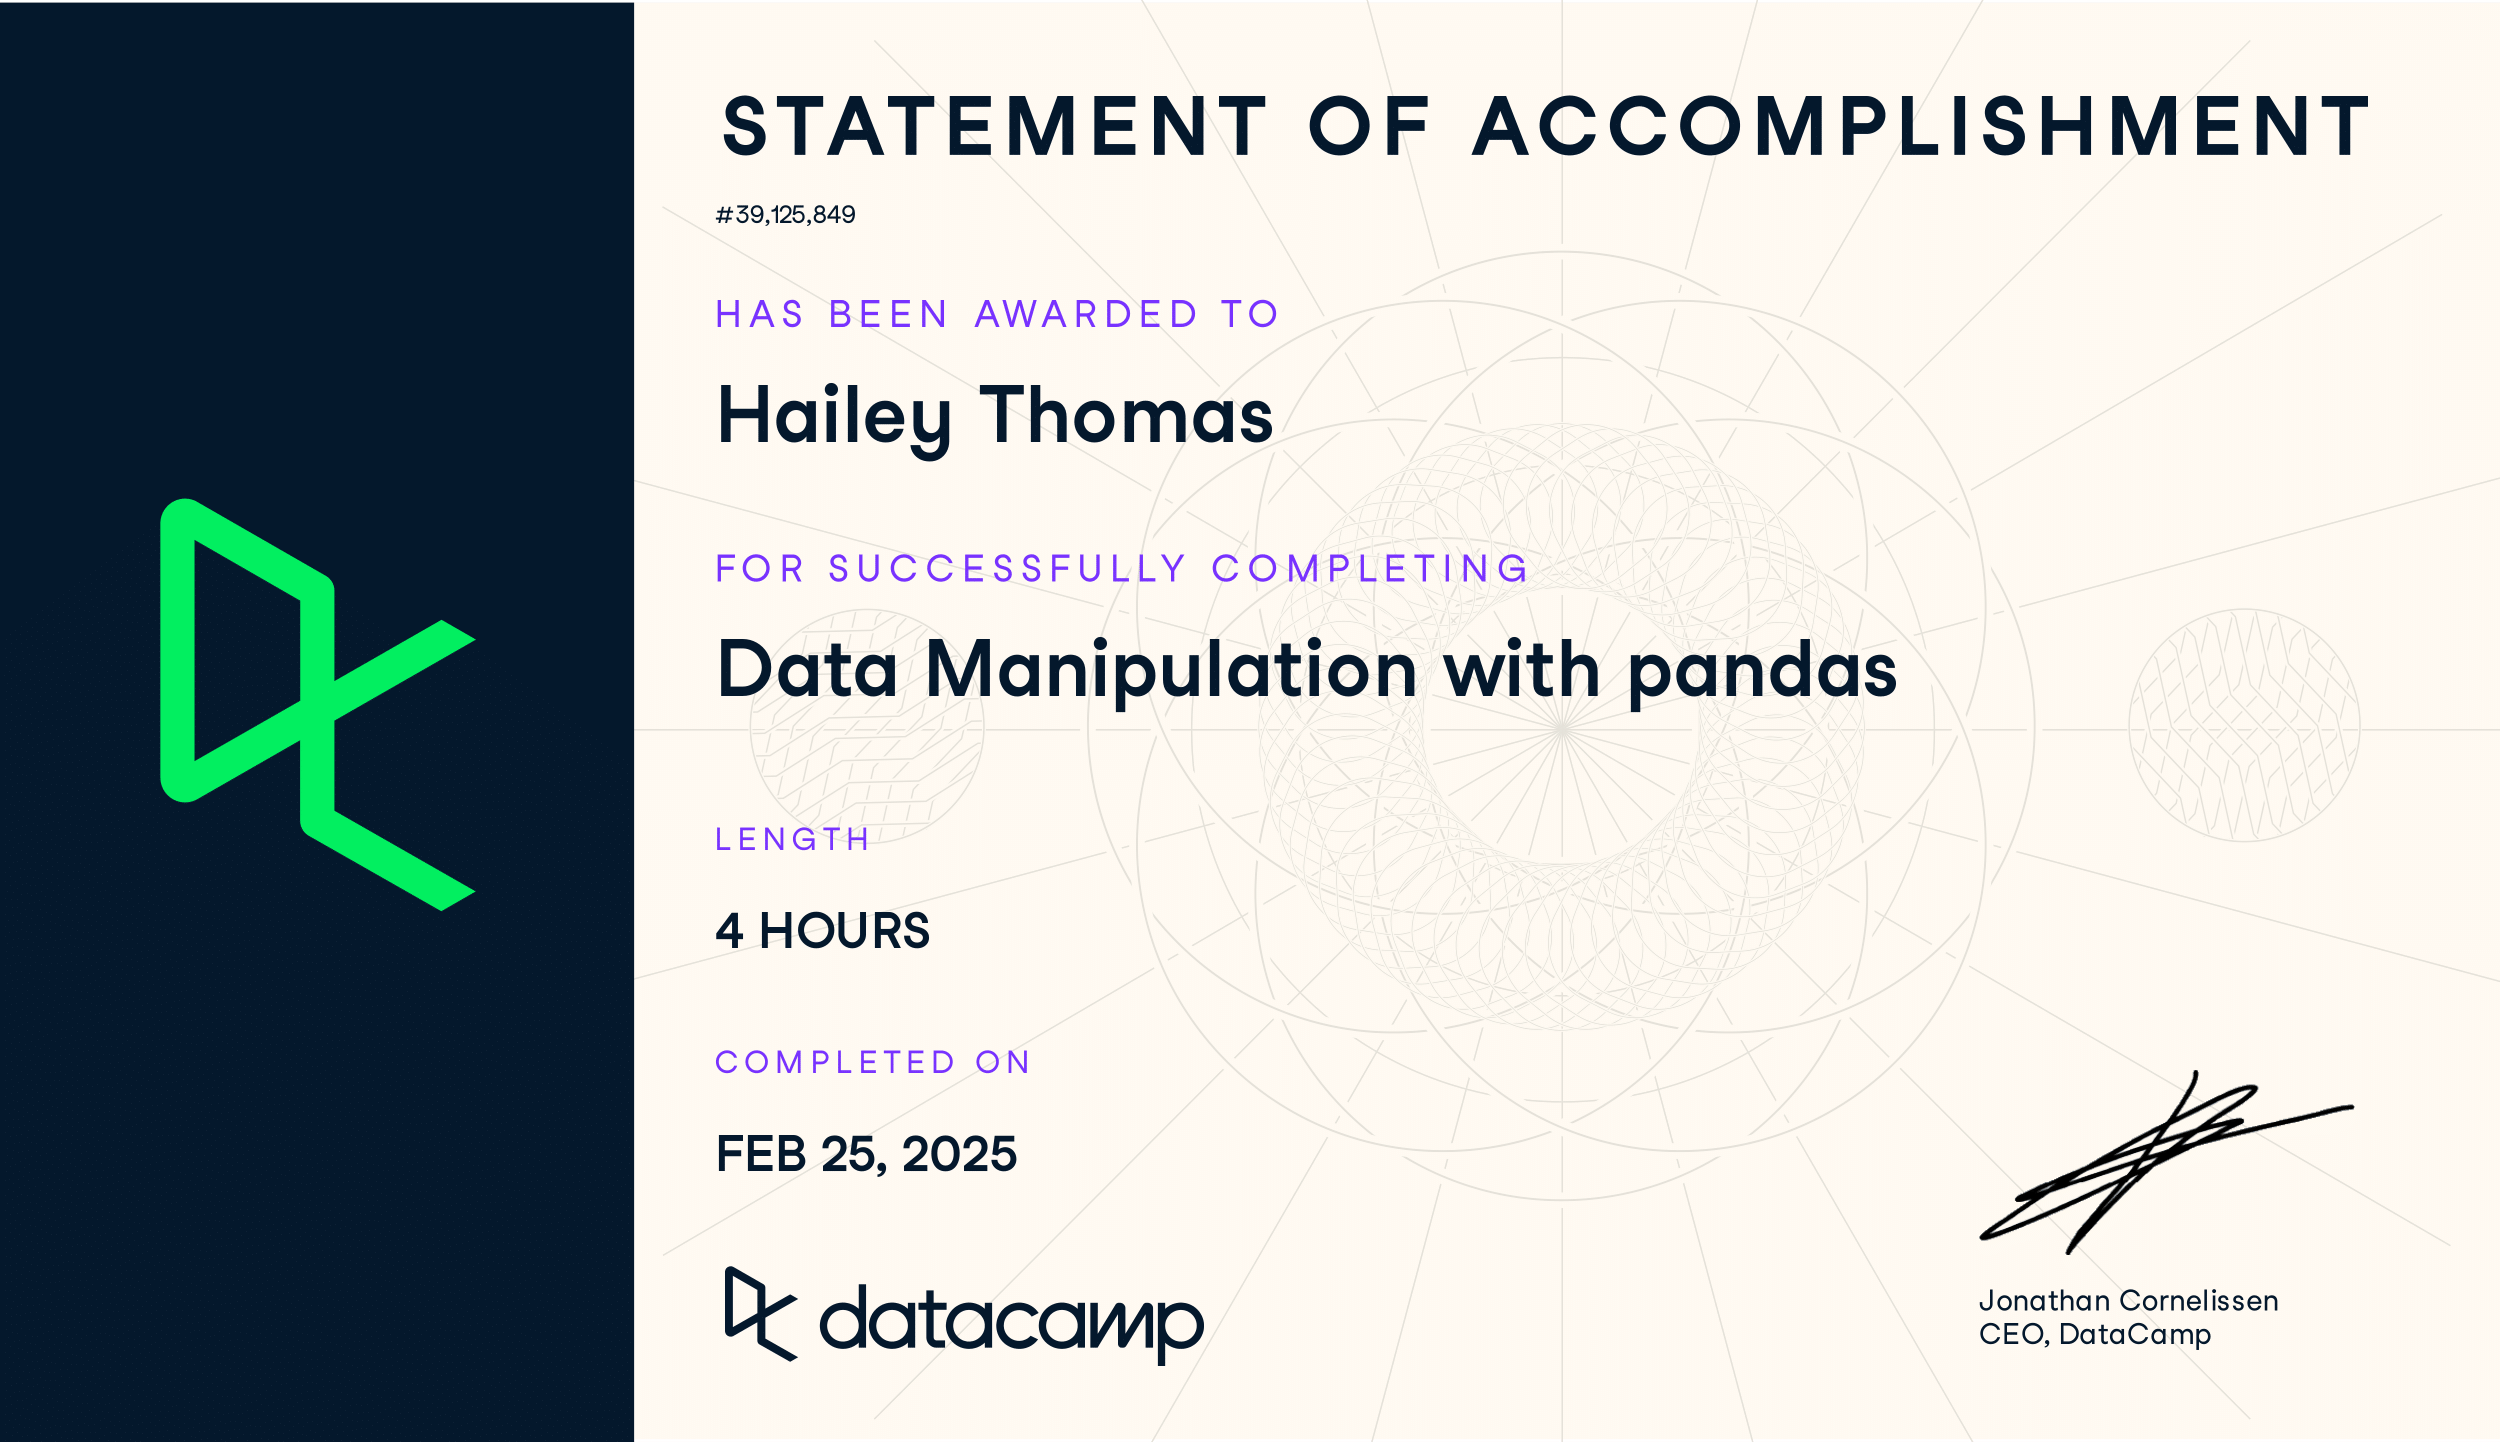
Here is a certification I earned from DataCamp. I mastered data cleaning, transformation, and analysis using pandas DataFrames and Series.
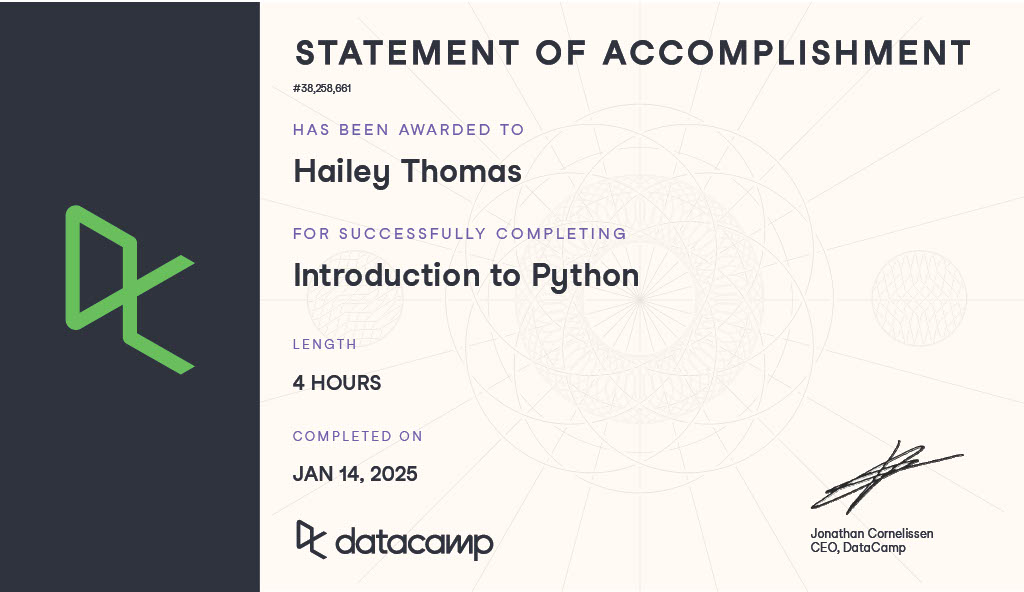
Here is a certification I earned from DataCamp. I learned Python basics, including variables, data structures (lists, dictionaries), loops, functions, and basic data analysis.
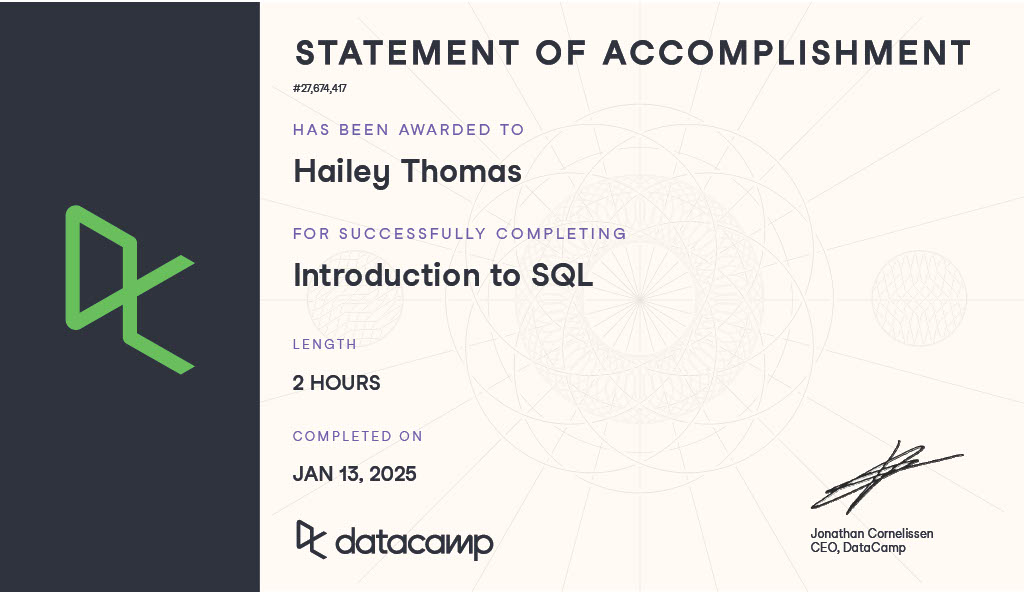
Here is a certification I earned from DataCamp. I gained skills in writing SQL queries, filtering and aggregating data, and retrieving information from databases efficiently.
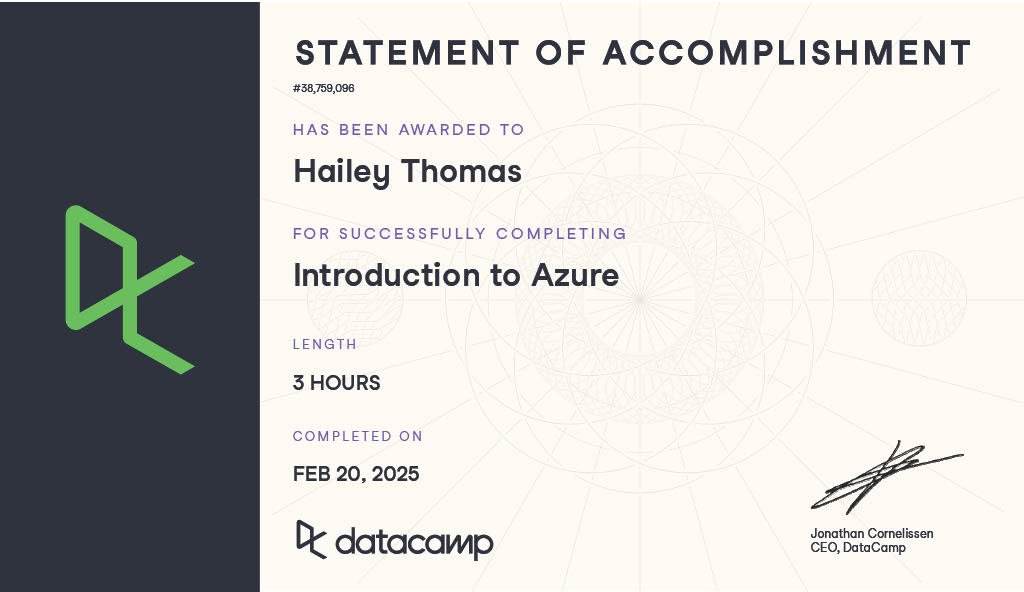
Here is a certification I earned from DataCamp. I understood fundamental cloud concepts, core Azure services, and how to manage cloud resources.
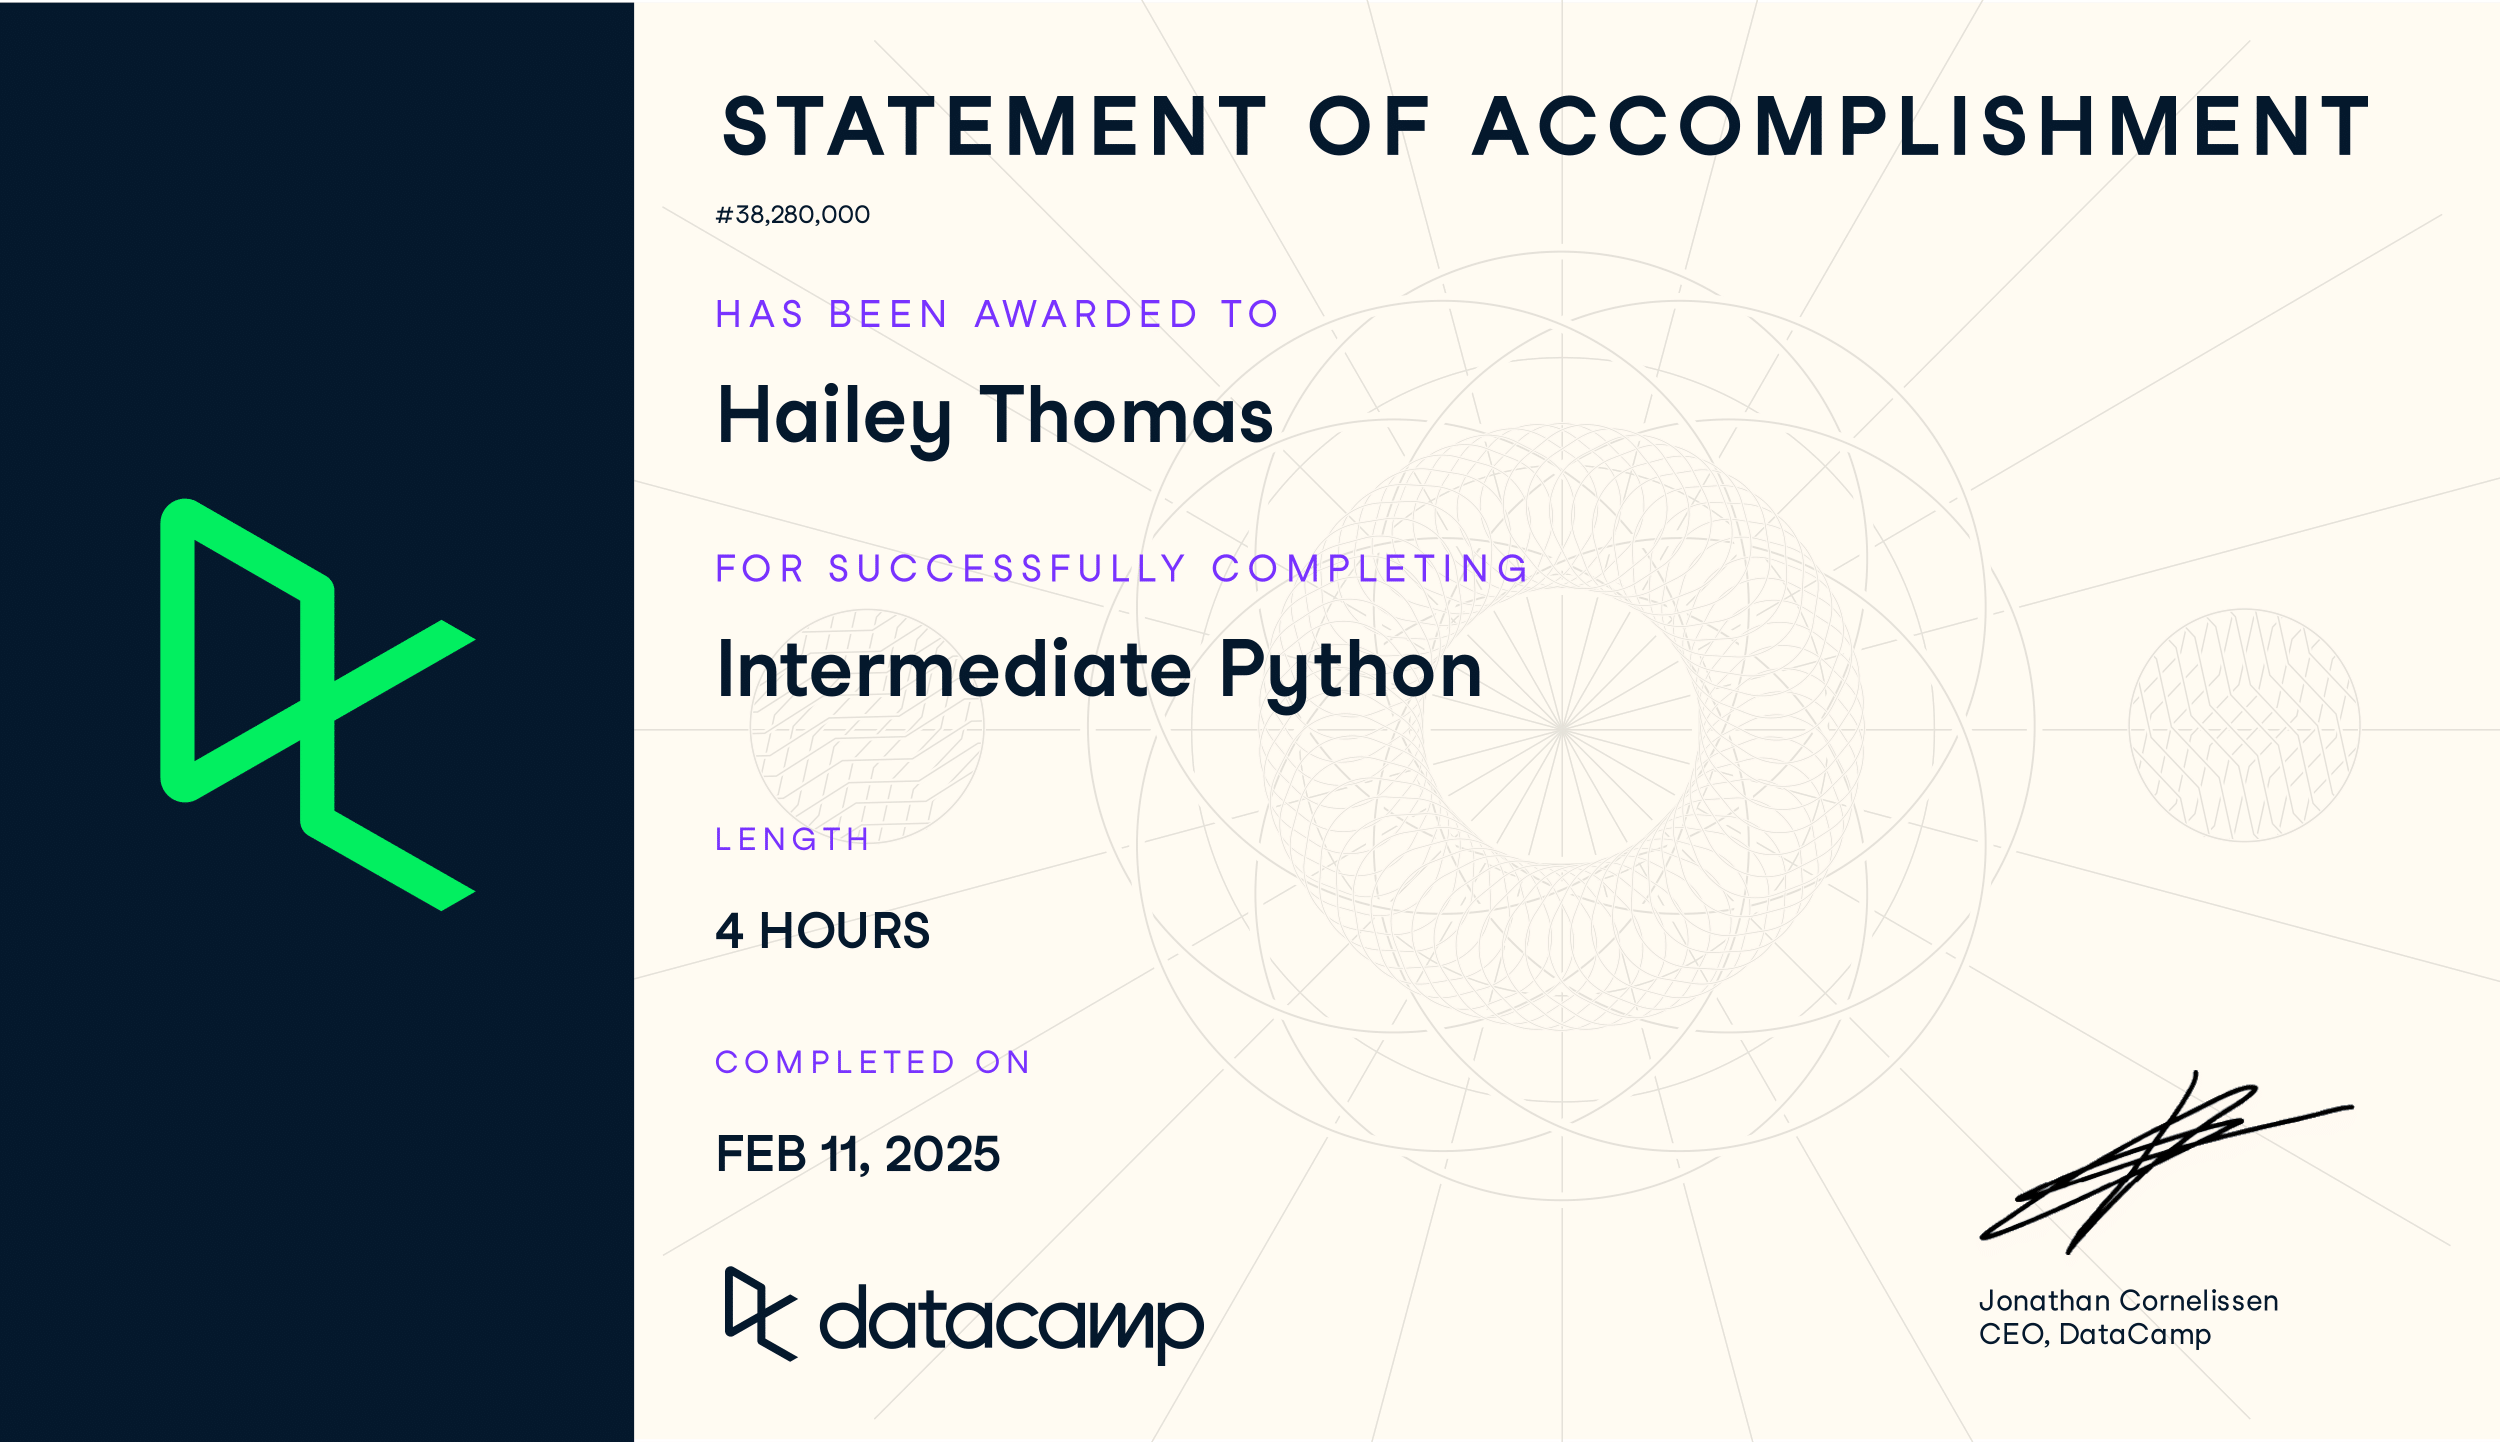
Here is a certification I earned from DataCamp. I built on Python knowledge with advanced topics like list comprehensions, error handling, iterators, and working with external libraries.
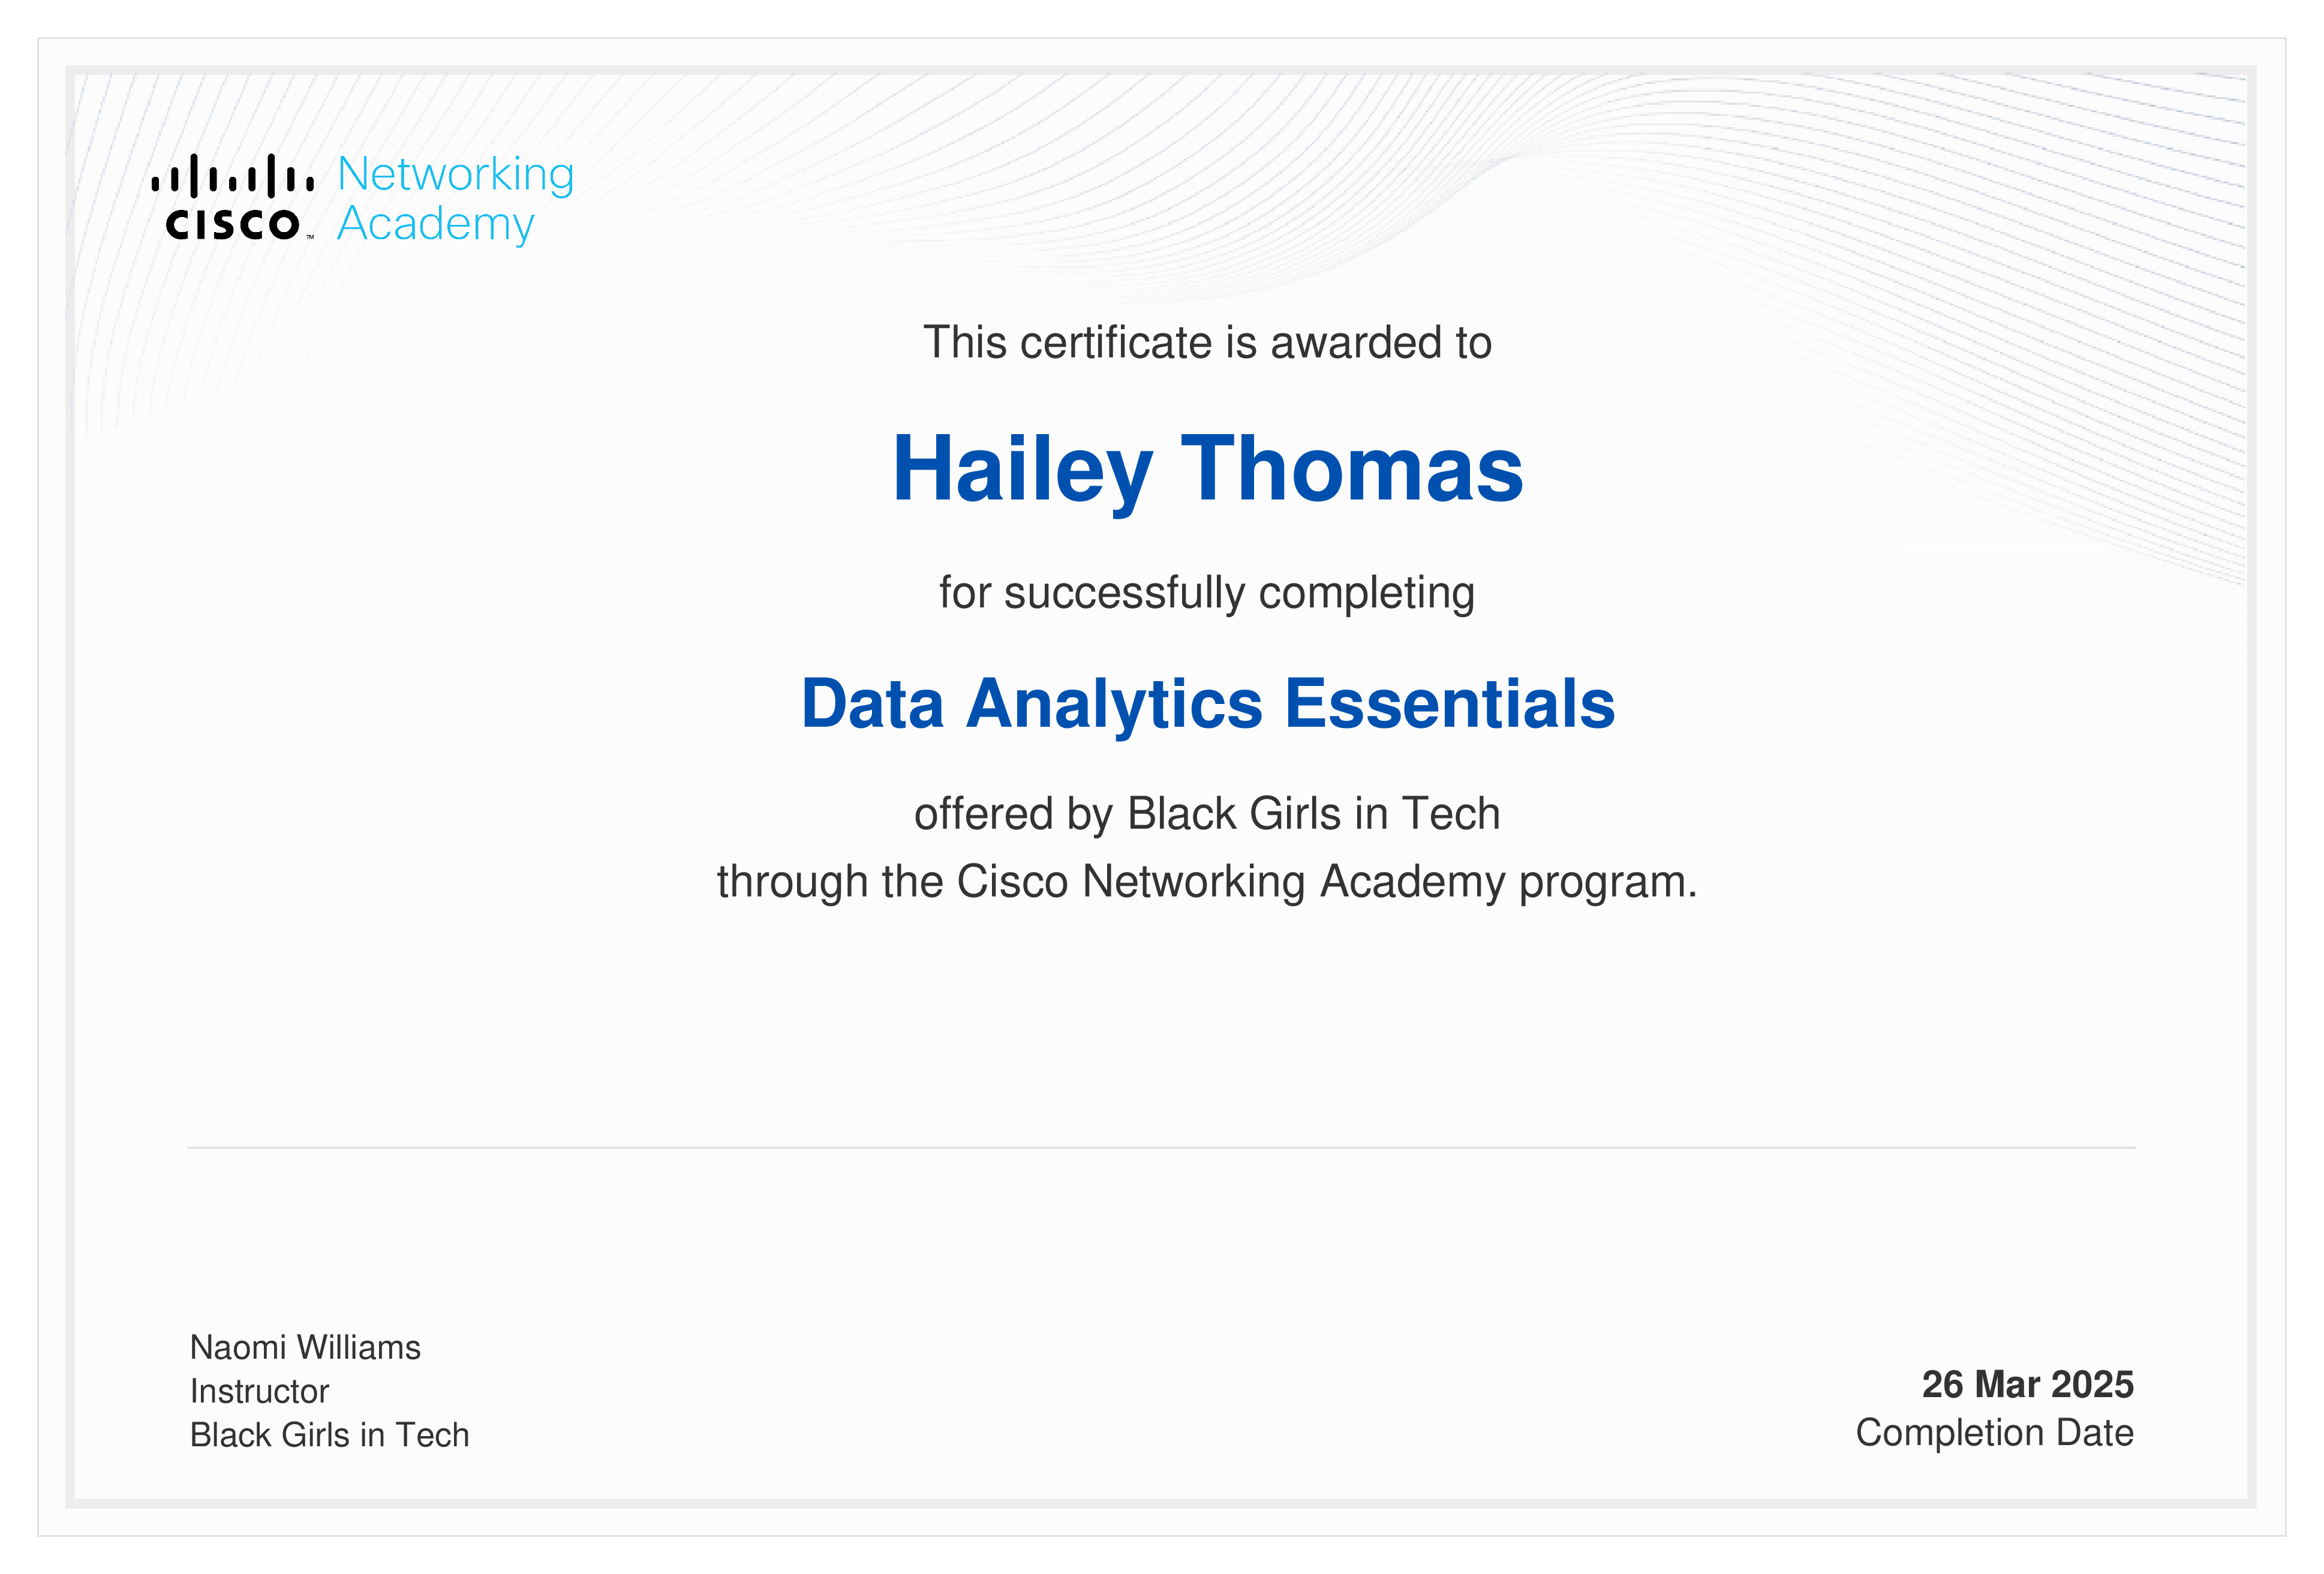
Here is a certification I earned from Cisco Networking Academy. This data analytics essentials course taught me the fundamental tools of a data analyst. I learned to transform, organize, and visualize data with spreadsheet tools such as Excel. I also learned how to query data from a relational database using SQL and how to improve my data presentations using powerful business intelligence tools like Tableau. By the end of the course, I had an analytics portfolio complete with an analysis of the popular movies dataset, showcasing your skills in Excel, SQL and Tableau.
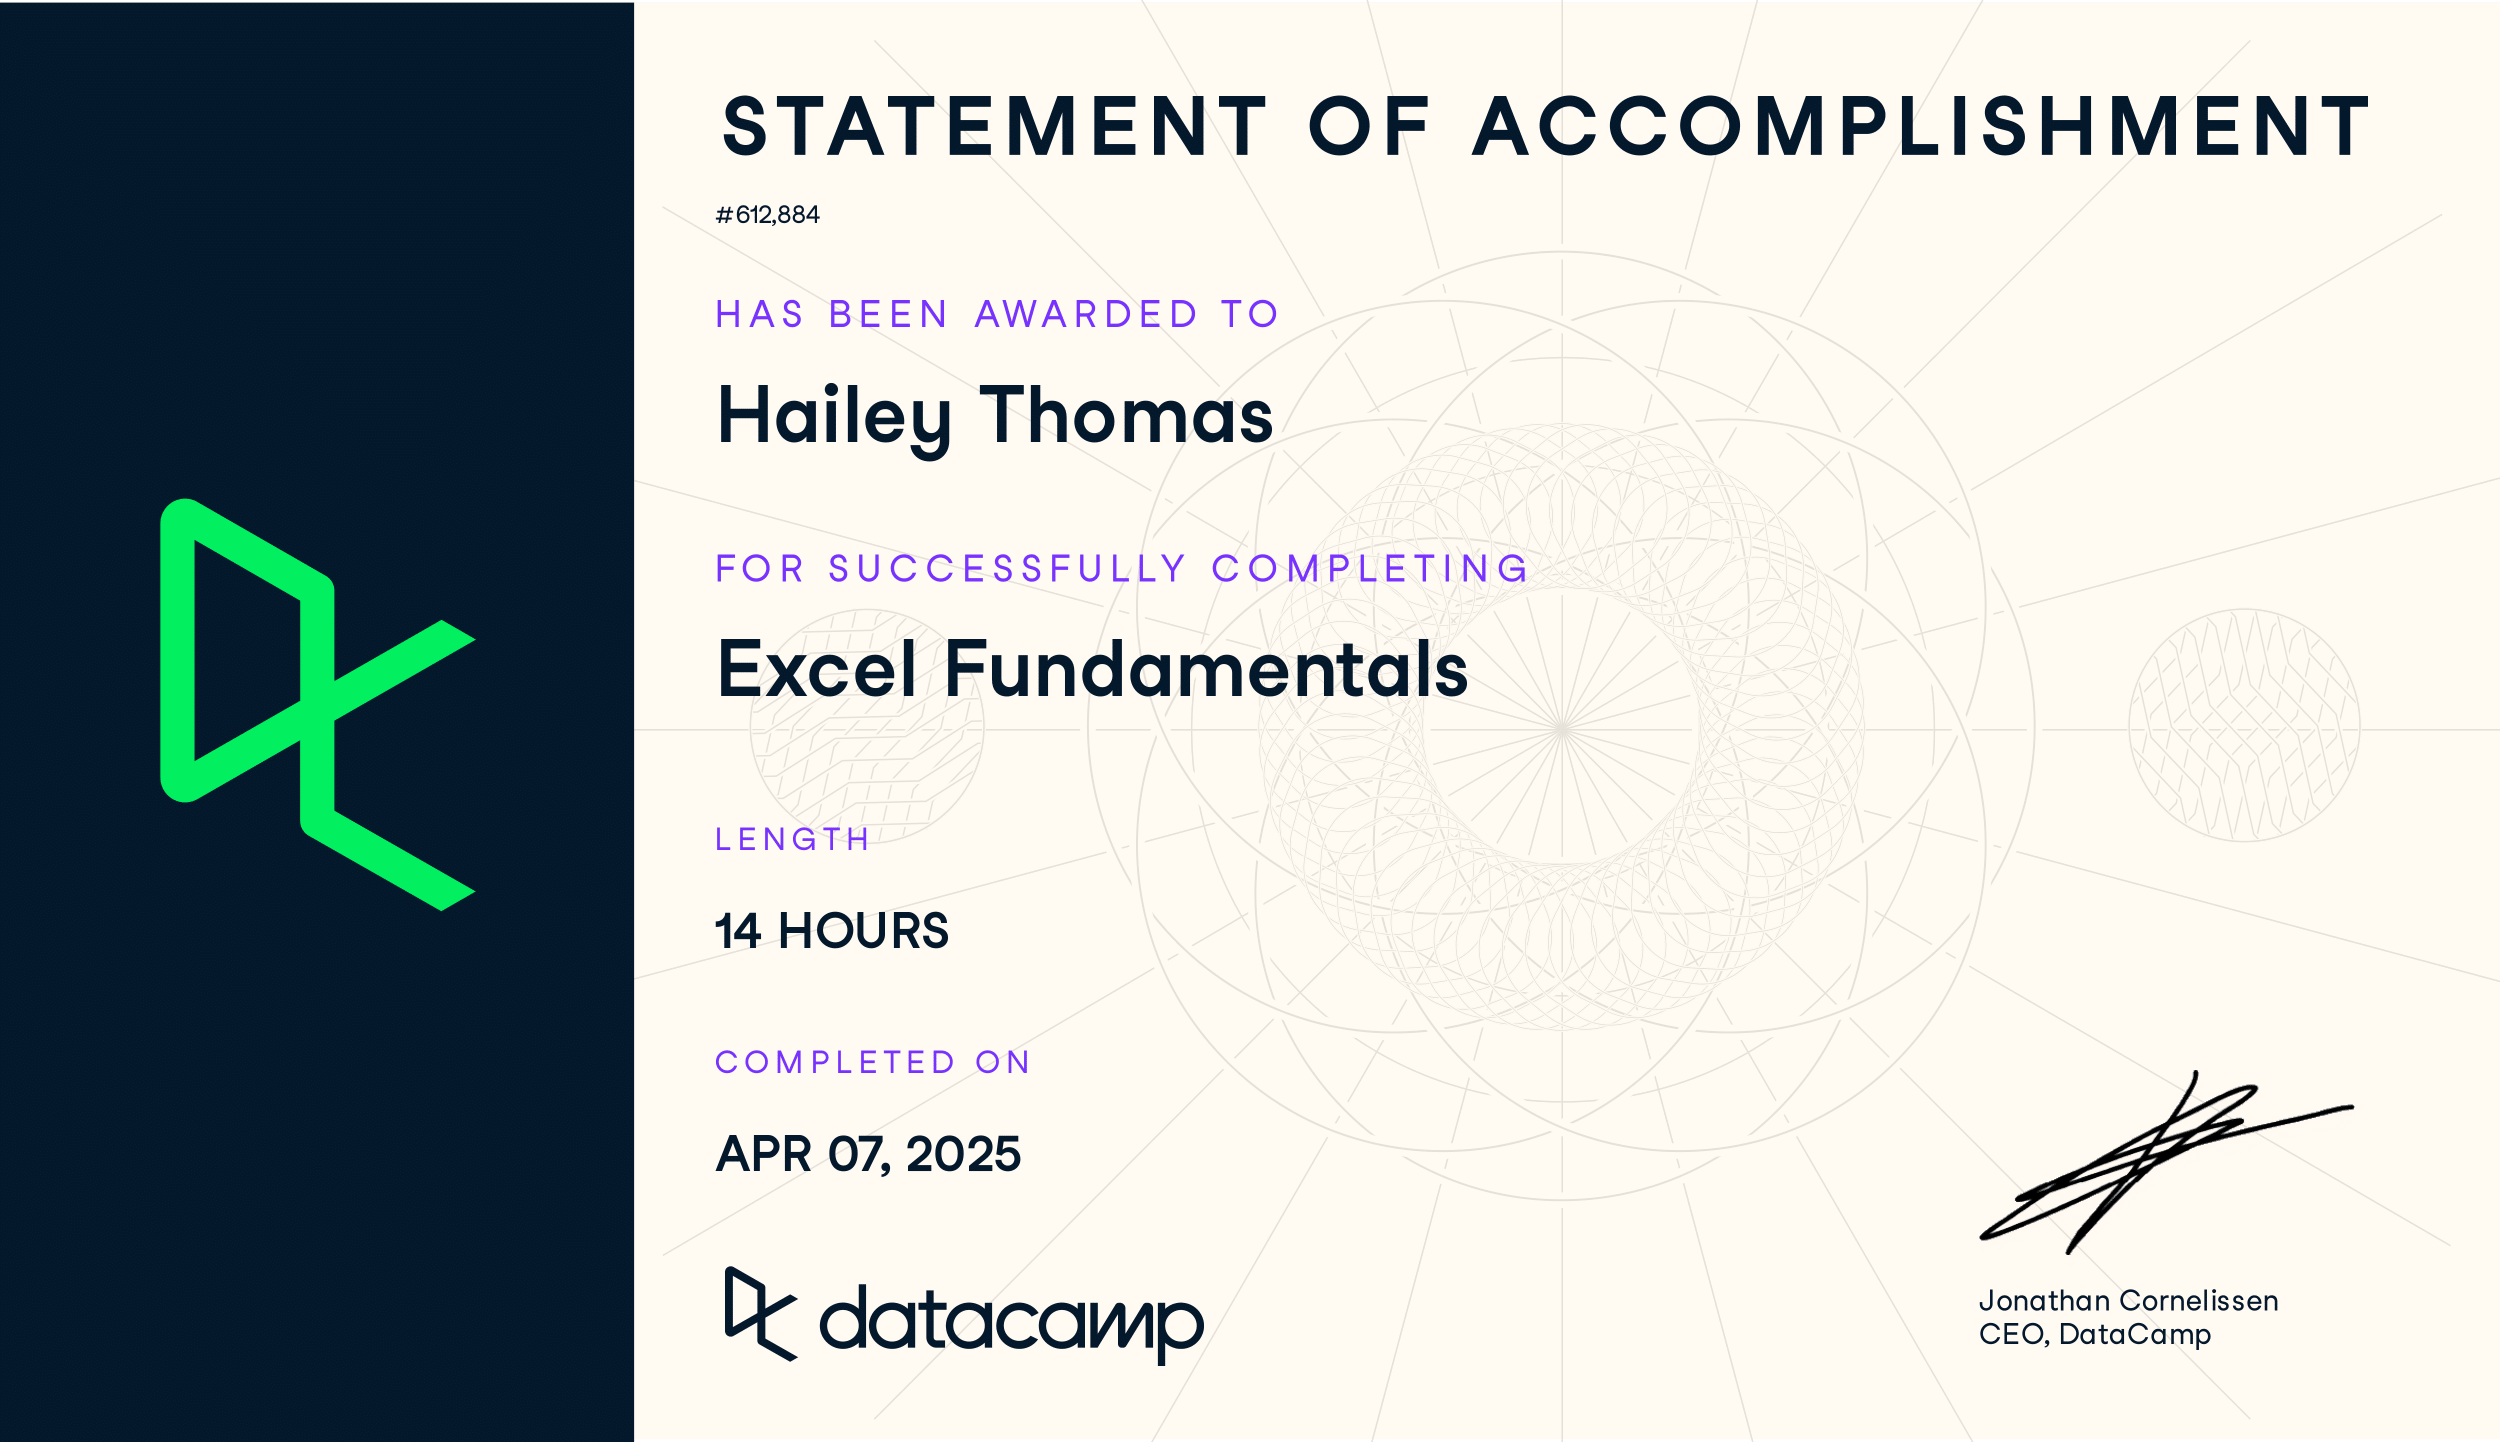
Here is a certification I earned from DataCamp. I took 5 Microsoft Excel courses below to earn this certification.
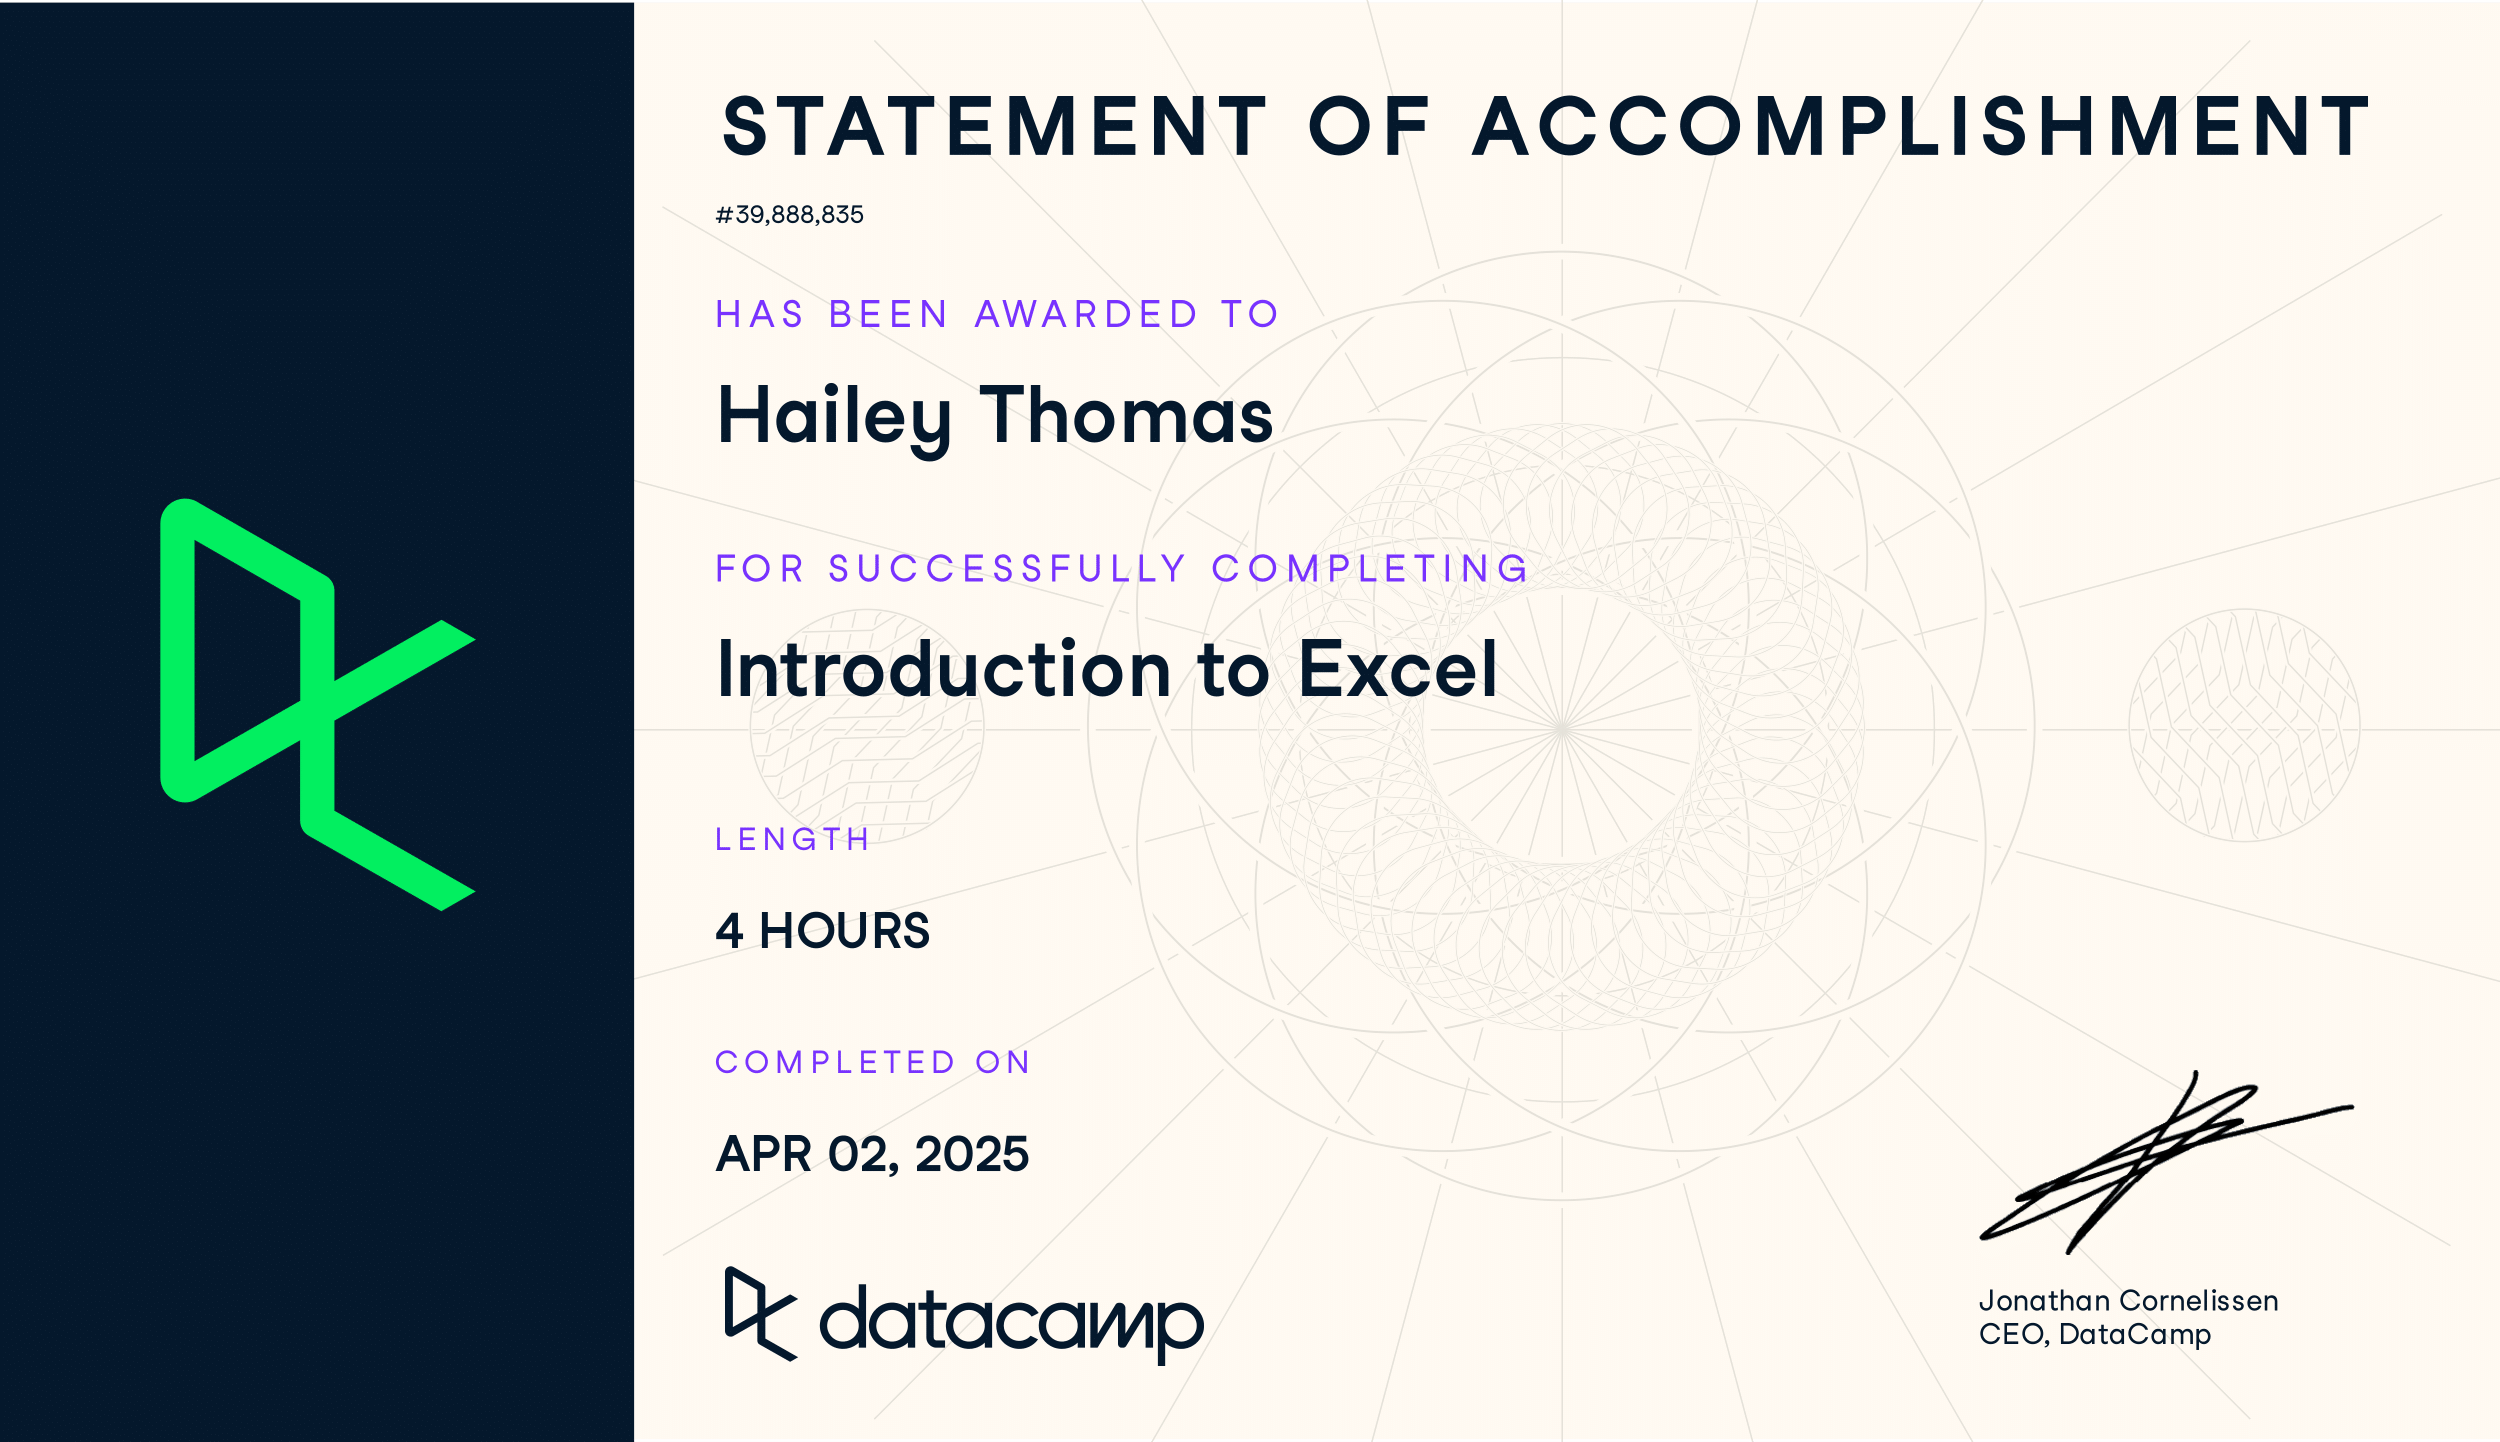
Here is a certification I earned from DataCamp. I learned Excel fundamentals like navigating spreadsheets, managing tables, and applying basic calculations. I used functions like SUM, AVERAGE, COUNT, UPPER, and LEFT to analyze data. I also explored area, column, and pie charts to visualize data and tell compelling stories with my analysis.
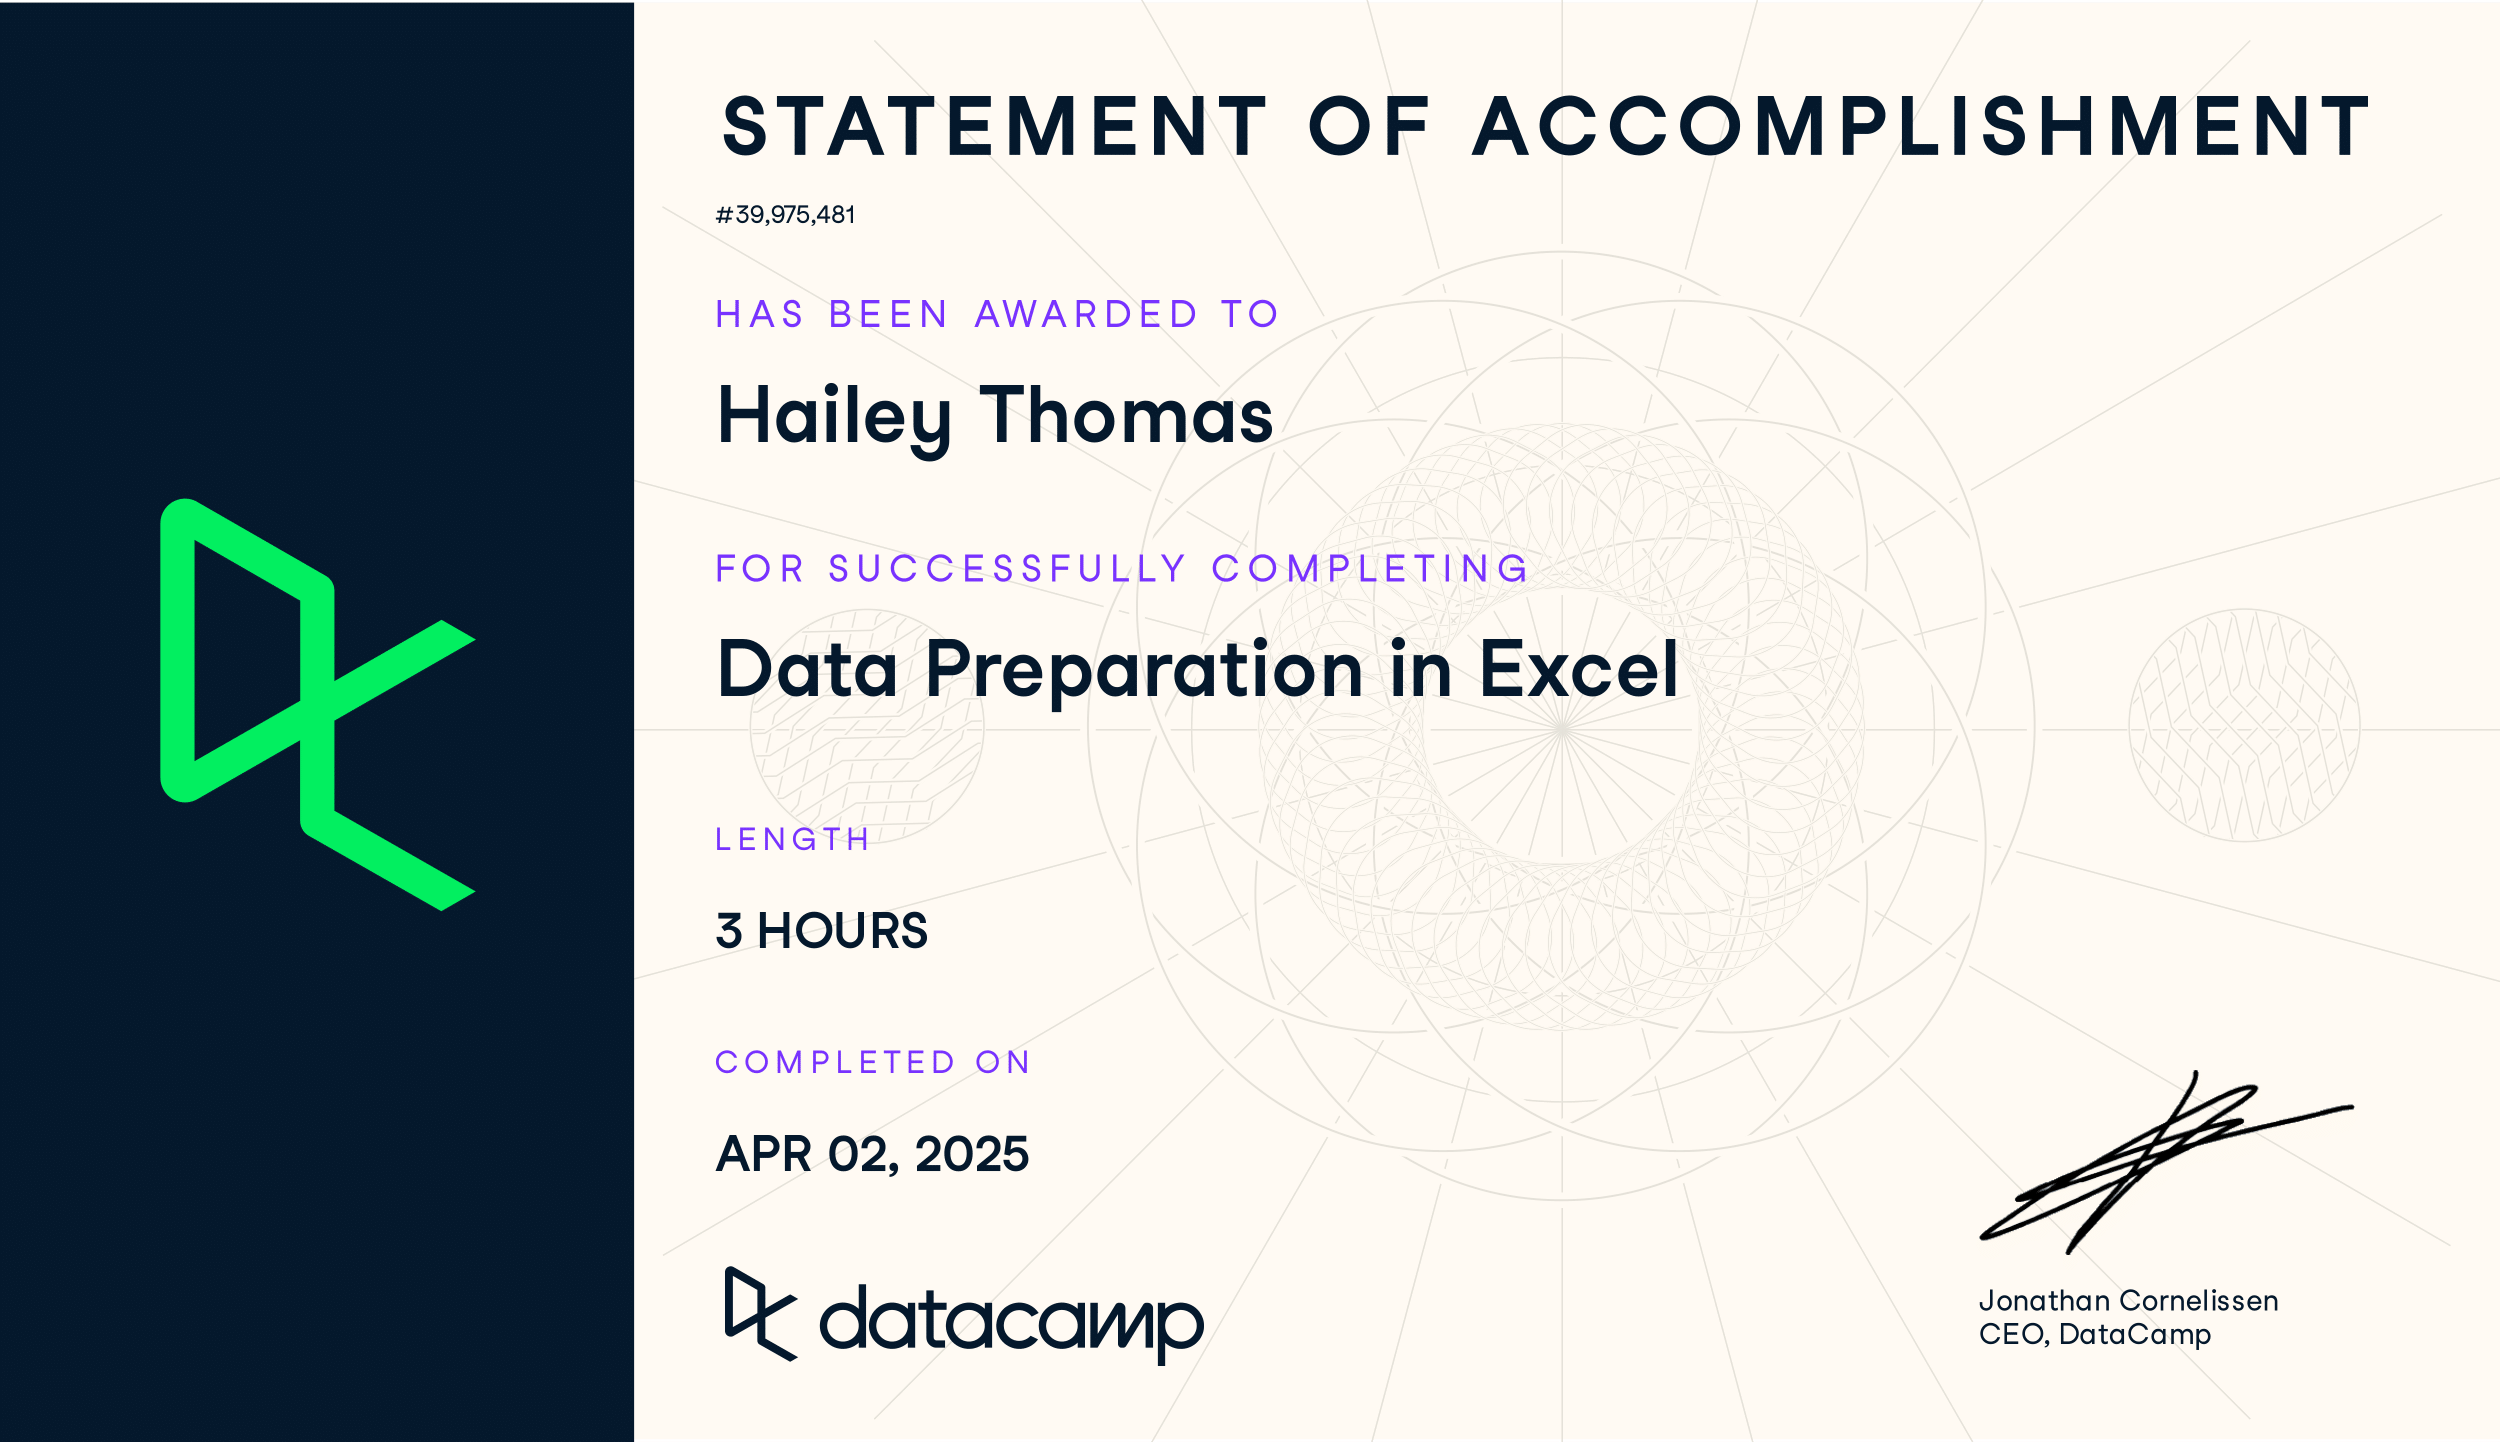
Here is a certification I earned from DataCamp. I learned how to clean and prepare raw data in Excel using filters, deduping, and organizing tools. I used functions to handle dates and text, created flags with nested logical formulas, and applied lookup functions across sheets. I also got introduced to PivotTables for summarizing large datasets.
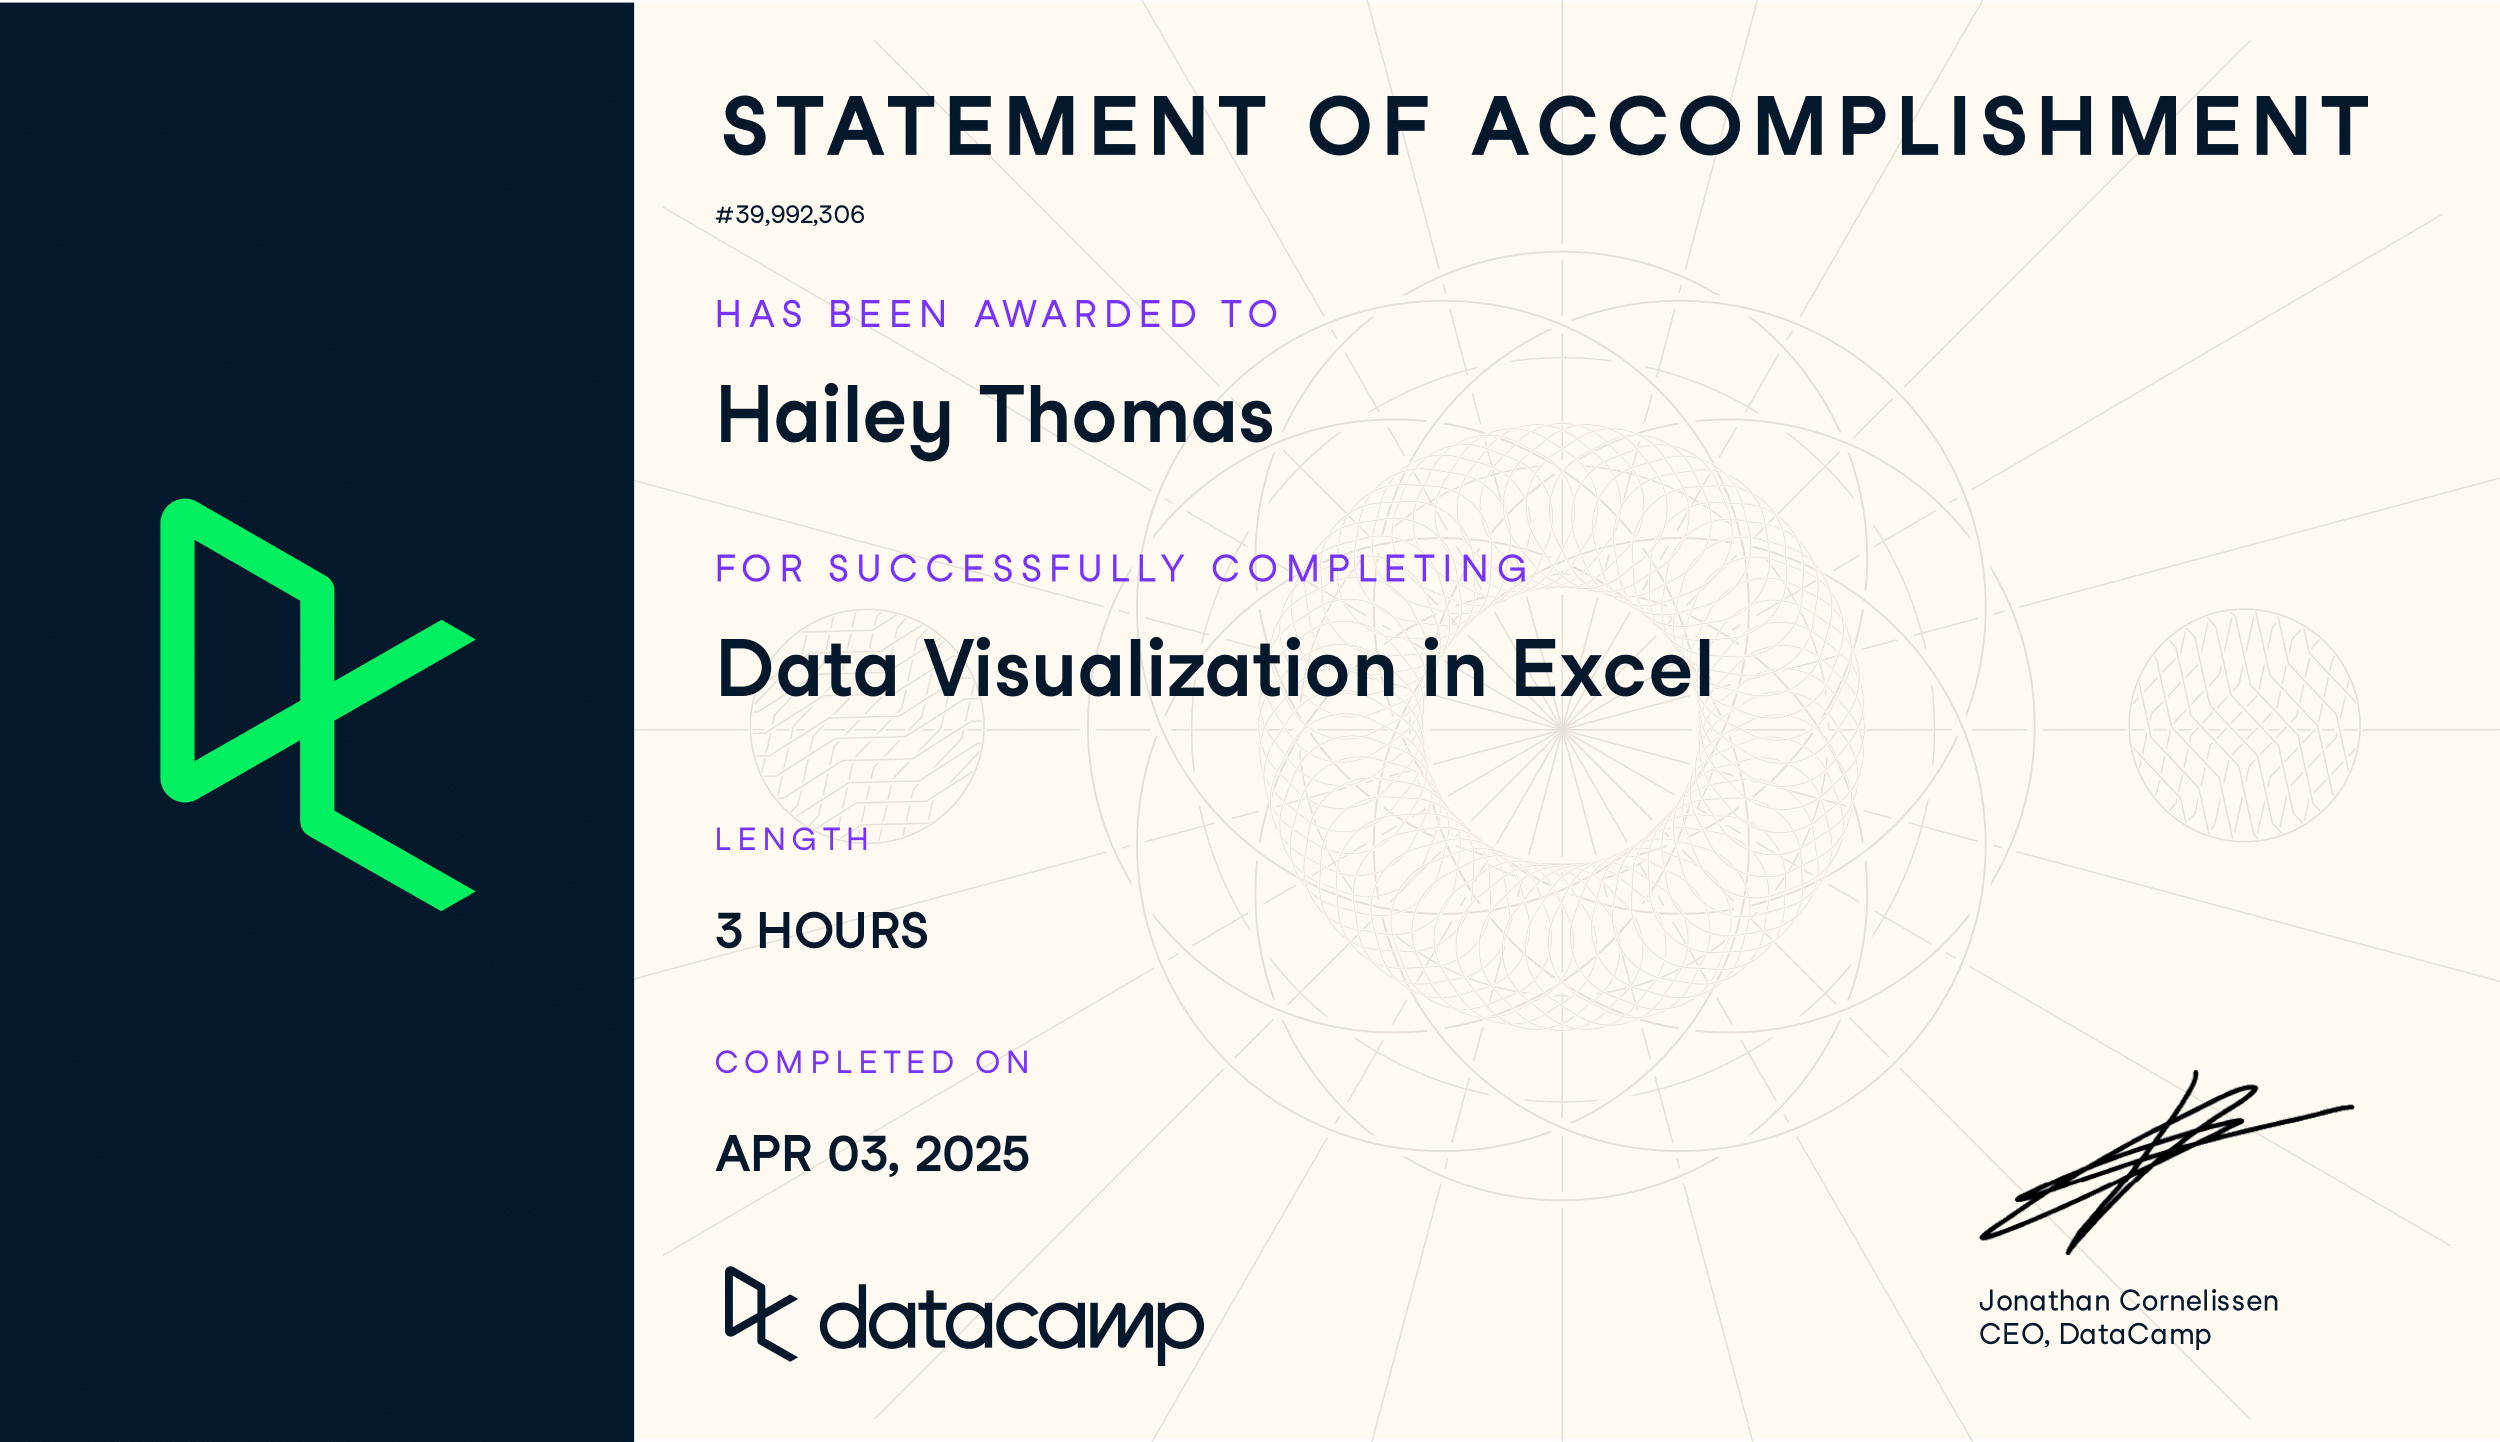
Here is a certification I earned from DataCamp. I learned to create and customize basic and advanced Excel charts, including Bullet, Waterfall, and Scatter plots. I explored best practices for data visualization, improved chart elements, and used PivotCharts with PivotTables to build dynamic mini-dashboards for disaggregated data.
Here is a certification I earned from DataCamp. I learned to use PivotTables to extract insights and speed up work with shortcuts. I applied intermediate logical functions for customer segmentation and strategy. I used What-If Analysis for scenario planning and forecasting tools like moving averages and trendlines to predict and visualize future trends.
Here is a certification I earned from DataCamp. I applied my Excel skills in a case study analyzing customer churn for a telecom company, Databel. I explored reasons behind churn using calculated columns, PivotTables, and built a dashboard to present key insights and help reduce churn rates.
Here is a certification I earned from DataCamp. I learned how to navigate and use Snowflake, a leading cloud-based data warehousing platform. This course guided me through Snowflake’s architecture, Snowsight for SQL-based queries, and methods for ingesting, integrating, and managing data from various sources. I also explored role-based access control, query monitoring, and performance optimization.
Here is a certification I earned from DataCamp. I learned how to use Alteryx Designer, create workflows with a user-friendly drag-and-drop interface. I also was able delve into data preparation, covering data cleaning, transforming, and organizing using Alteryx Designer’s tools like Select, Sort, and Sample. Then, use the Unique tool to remove duplicates, the Summarize tool to aggregate data, and the Comment tool to document my workflows.
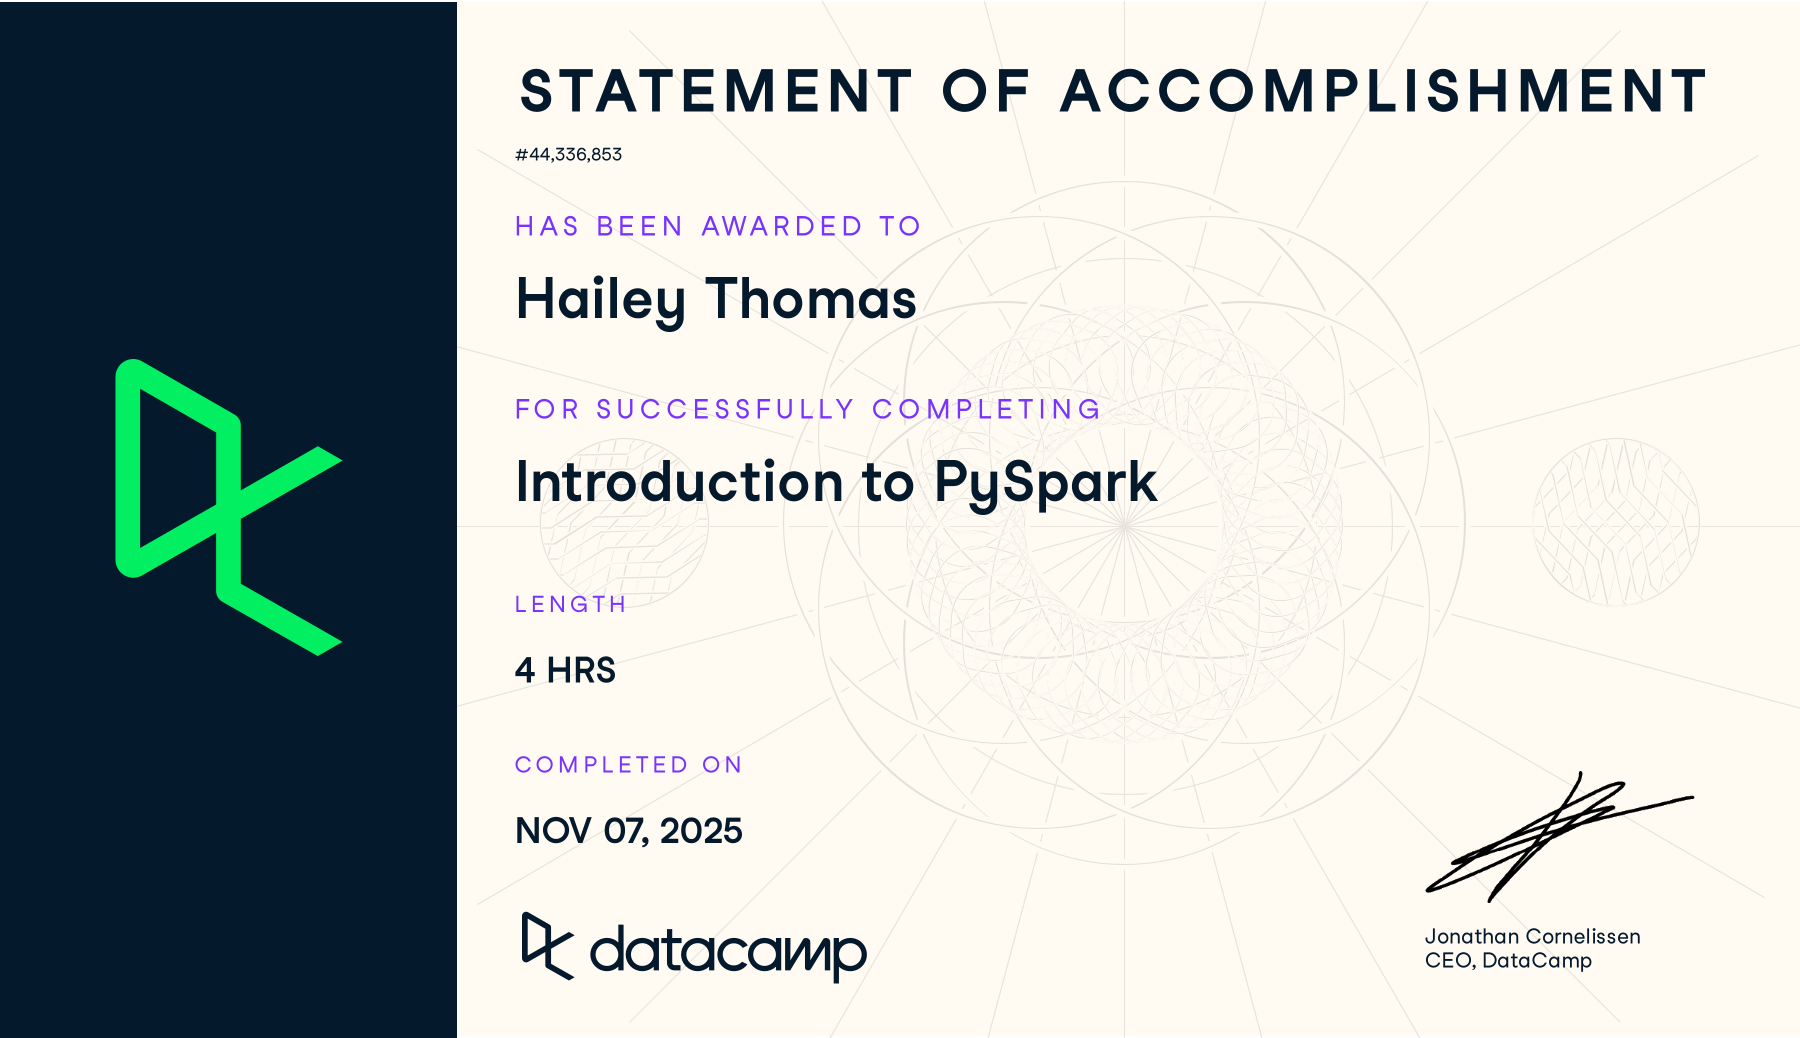
Here is a certification I earned from DataCamp. I learned to set up Spark sessions and dive into core components like Resilient Distributed Datasets (RDDs) and DataFrames. I also learned how to filter, group, and join datasets. I had the opportunity to harness PySpark SQL for querying and managing data using familiar SQL syntax, tackle schemas, complex data types, and user-defined functions (UDFs), and build confidence to handle, query, and process big data using PySpark.
While in high school, I was also a Dual Credit student, taking college and high-school-level classes. Once I graduated high school, I already completed my first year of college. My Alvin Community College GPA (GPA 3.45/4.00). Once I graduated high school in 2021, I started completing my required course and elective for my major. Clicking the photo will show you the relevant courses I've taken.
Here are some of the projects I've worked on during my technical experience. From internships, part-time, to full-time, I've worked on projects throughout my employment that have assisted in sharpening my Data Analytics skills.
.svg.png)
During my junior year of college, I attended a summer internship with Mississippi Power Company (MPC) in Gulfport, MS where I performed weekly tasks related to applications used, ensuring they smooth functioning and resolving any issues that arose, assisted in installing software and troubleshooting hardware for field mobile computers, ensuring optimal performance, utilized Oracle SQL Developer to create queries assigned by management, effectively extracting and manipulating data, designed Power BI dashboards using SQL assigned queries, providing insightful visualizations for data analysis, assisted with adding, removing, and updating features on ArcMap using GIS, contributing to accurate and up-to-date mapping, collaborated in creating, maintaining, and validating the accuracy of reports, ensuring data integrity, posting updates to the Distribution GIS database, ensuring accurate and timely information for stakeholders, creating specialized map products, delivering high-quality visual representations of geospatial data, and successfully reconciled data conflicts, ensuring consistency and accuracy in database records.
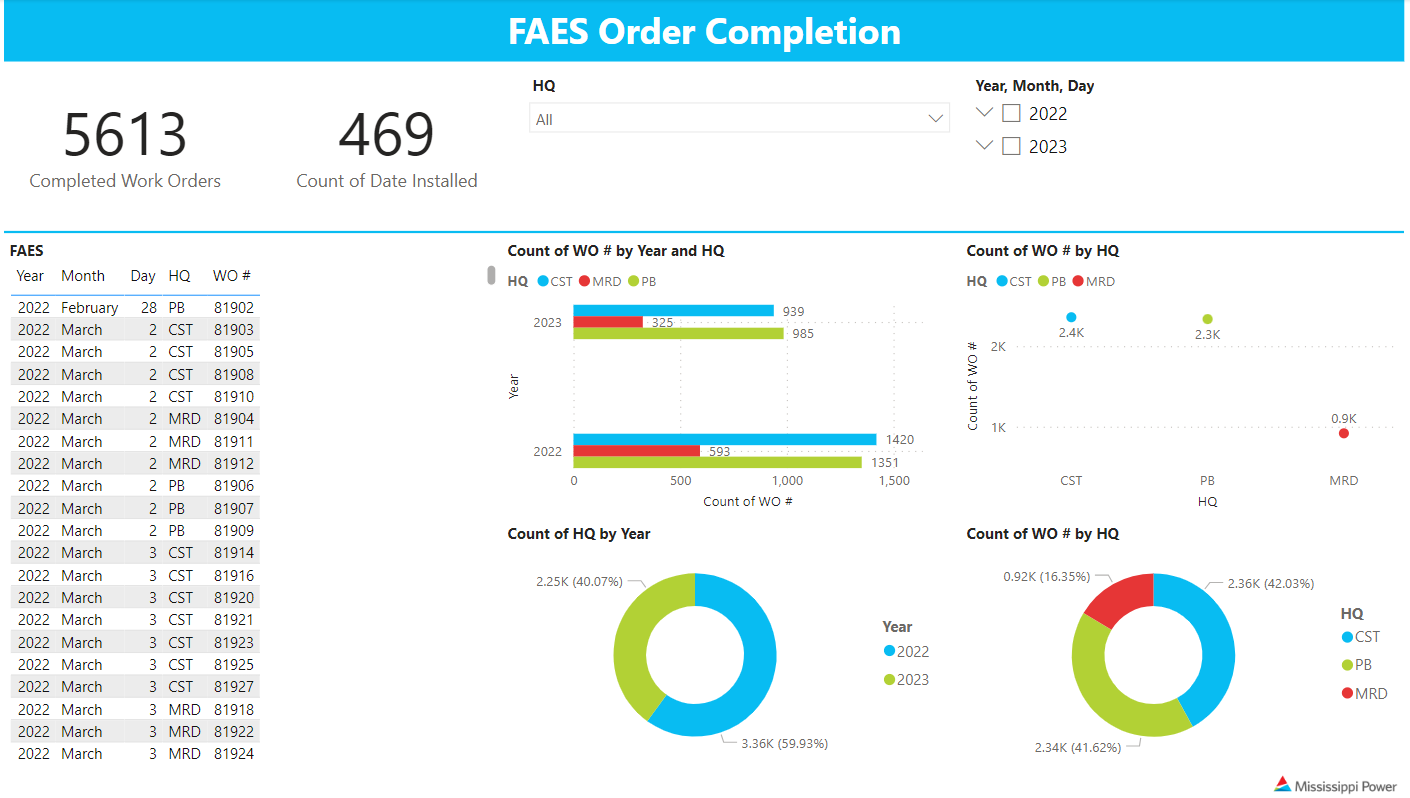
Over 5500 work orders needed to be completed. The primary goal of the MPC FAES Form completion project was to edit, add, and remove features on the DistGIS ArcMap from work orders received from service men and line crew. I leveraged my GIS and workflow automation expertise during the project using tools like ArcMap. I also use problem-solving skills to identify accurate locations and interpret work orders. The successful completion of the MPC FAES Form Completion Project led to improved operational efficiency, reduced time duration of completing past work orders, more accurate NLC processing, and increased knowledge of completing work orders. Pictured is a visual representation of the FAES data collected. Clicking on the photo will take you to a link to my LinkedIn projects that include all the details about the data I collected.
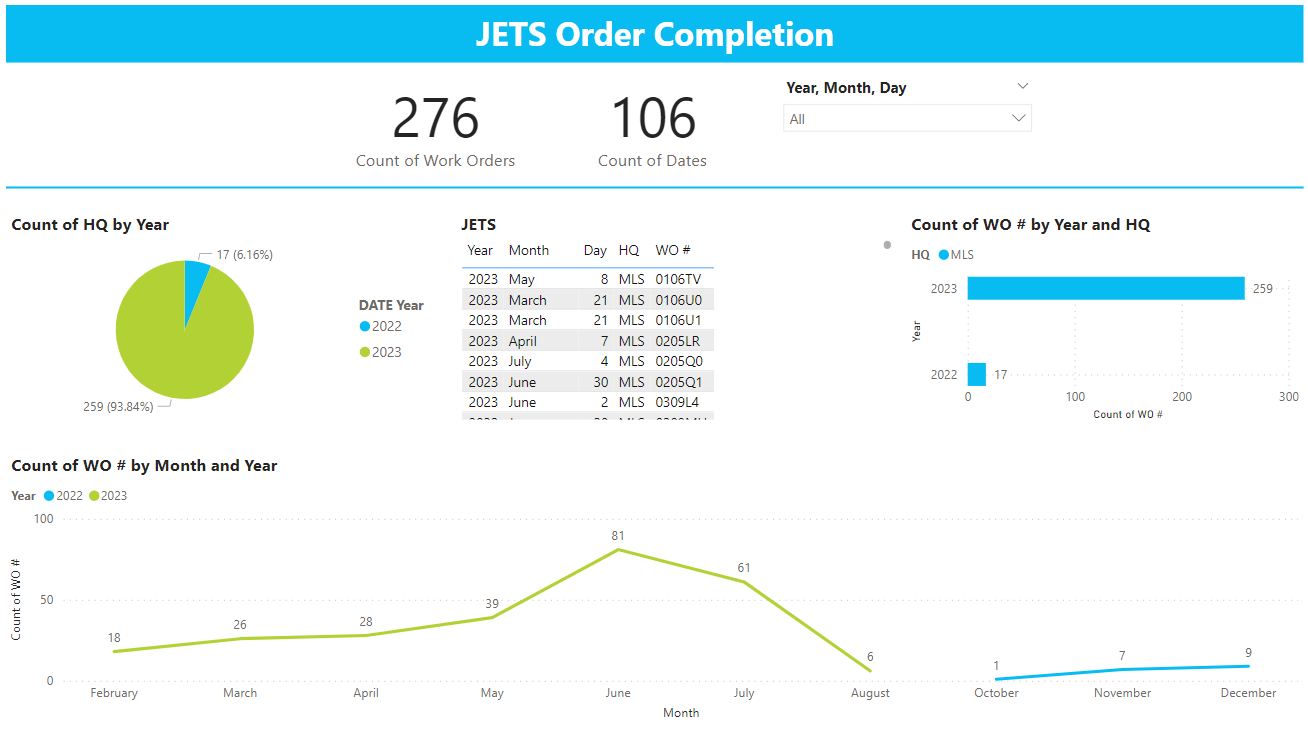
The primary goal of the MPC JETS Form completion project was to edit, add, and remove features on the DistGIS ArcMap from work orders received from service men and line crew. I leveraged my GIS and workflow automation expertise during the project using tools like ArcMap. I also use problem-solving skills to identify accurate locations and interpret work orders. The successful completion of the MPC JETS Form Completion Project led to improved operational efficiency, reduced time duration of completing past work orders, more accurate NLC processing, and increased knowledge of completing work orders. Pictured is a visual representation of the JETS data collected. Clicking on the photo will send you to the GitHub repo!
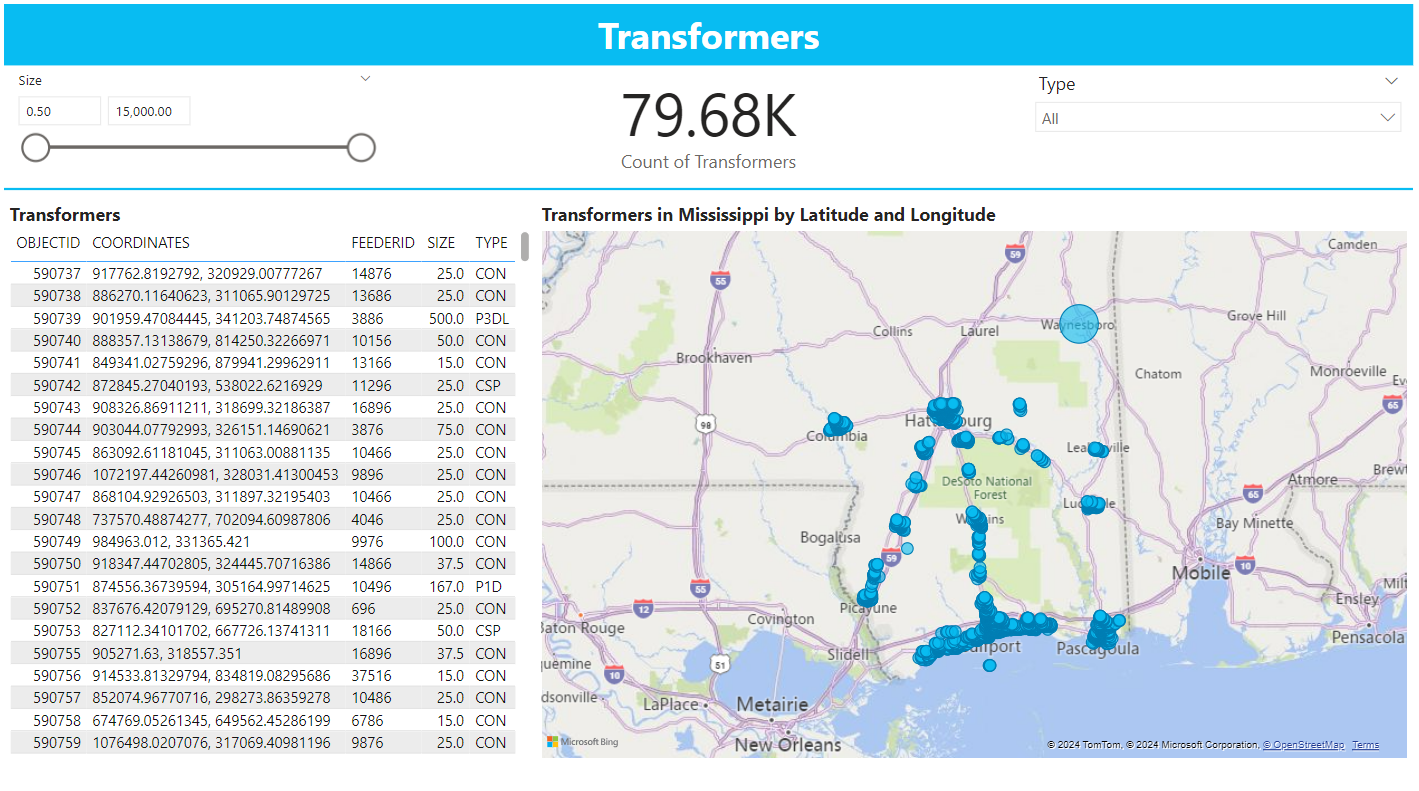
The primary goal of the MPC Power BI Dashboard Project was to visualize data collected from SQL queries created on Oracle SQL Developer. I leveraged my SQL and data visualization expertise during the project using tools like Power BI and Oracle SQL Developer. I also utilized my strong problem-solving skills to identify accurate data and interpret how to create understandable visuals. The successful completion of the MPC Power BI Dashboard Project led to improved management understanding, accurate data visualizations for recent data collected, more experience working with SQL, and increased knowledge of creating dashboards. Pictured is the Transformer page of my MPC Power BI Dashboard. Clicking on the photo will send you to the GitHub repo!
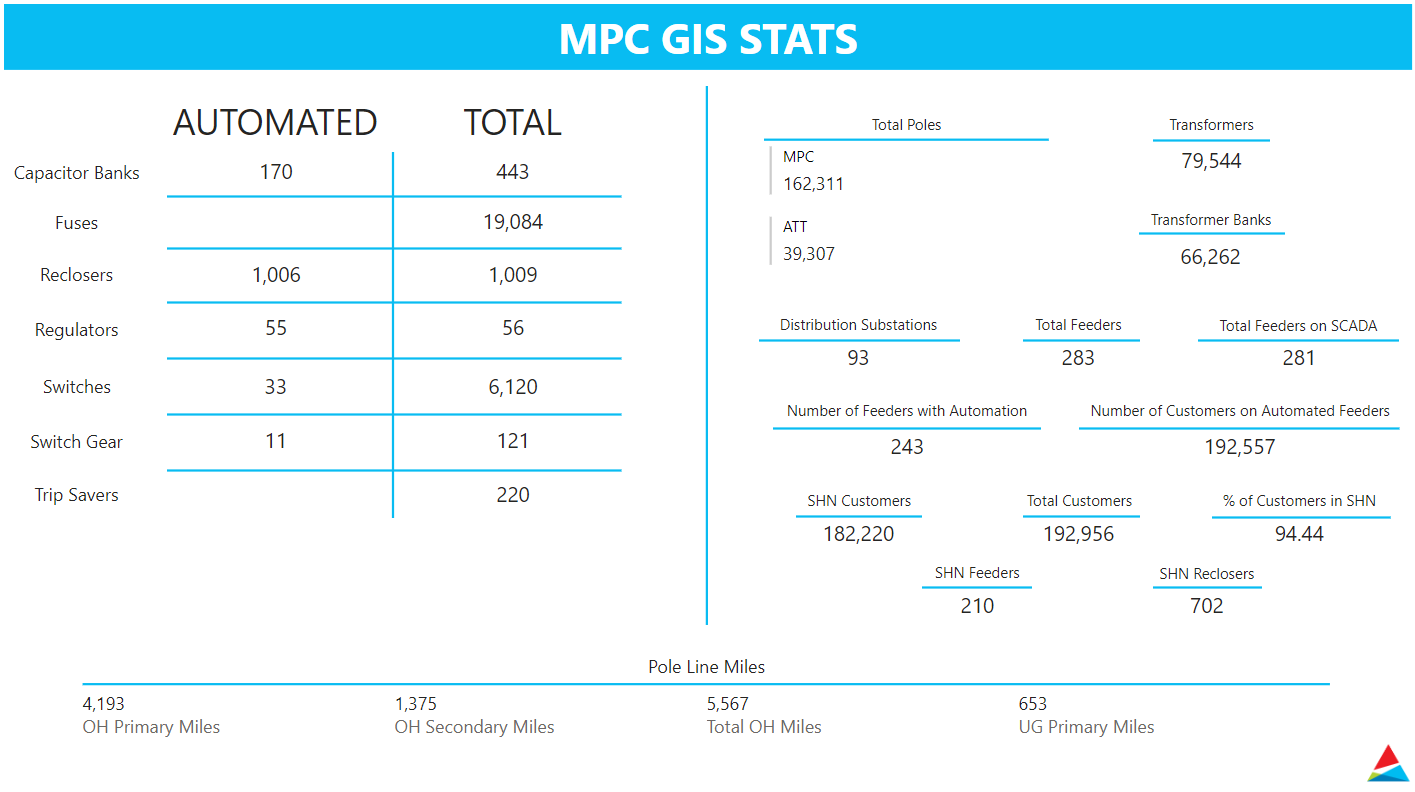
I am delighted to present my latest project, the Automation Device Count Power BI Dashboard. This project showcases my expertise in data analytics and proficiency in Power BI to streamline and optimize power distribution systems. I created 35 SQL queries that would display the information you see pictured. This comprehensive dashboard enables real-time monitoring and analysis of critical automation devices, providing valuable insights for optimizing power distribution efficiency and ensuring a reliable power supply to our customers. The dynamic visualizations and interactive features empower our team to make data-driven decisions and identify opportunities for improvement. I am proud to have contributed to this project and our organization's commitment to innovation in the energy sector. This dashboard reflects our dedication to delivering exceptional results and driving positive change. Pictured is the first page of my MPC Automation Device Count Power BI Dashboard. Clicking on the photo will send you to the GitHub repo! Clicking on the photo will take you to a link to my LinkedIn projects where I have images of the other pages I worked on.
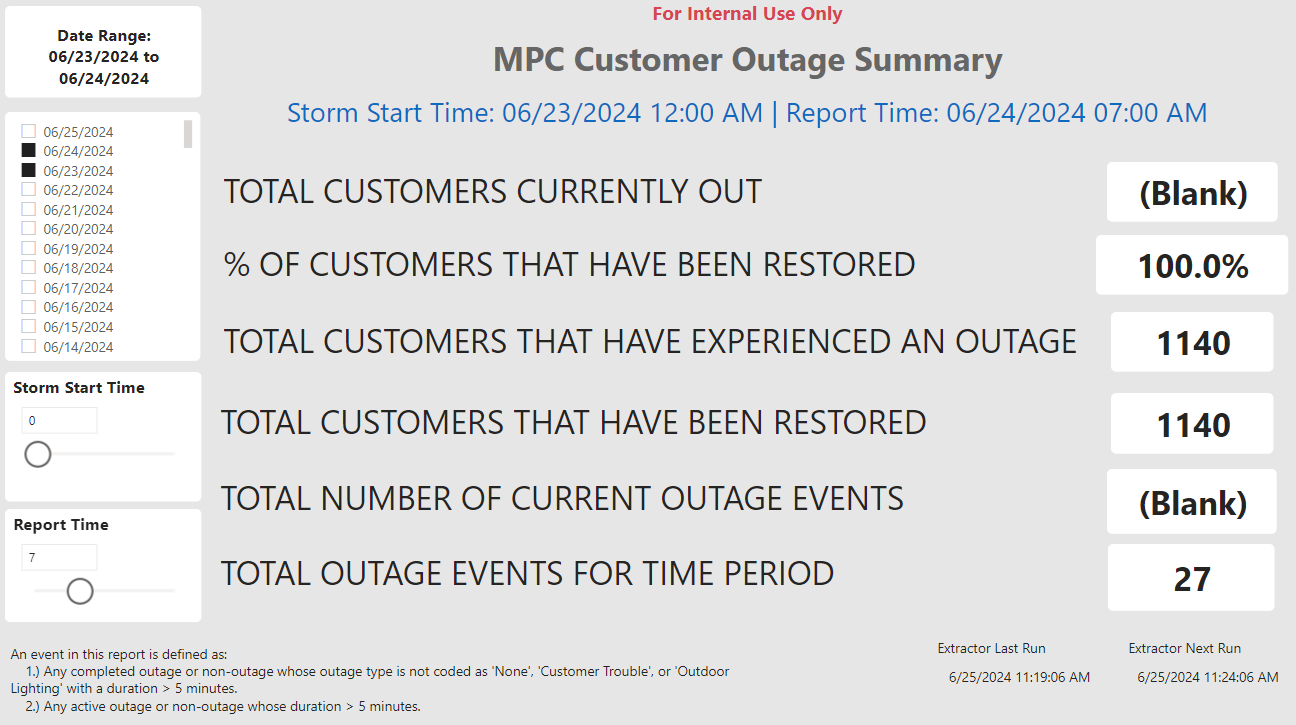
During my internship in 2024, I had the opportunity to develop a Power BI Dashboard for Mississippi Power Company, demonstrating proficiency in data analytics using Power BI and Oracle SQL Developer and ensuring the solution offers contextually appropriate feedback for different selection scenarios, enhancing user experience and reporting accuracy. I linked slicers to key performance indicators (KPIs) including totCustActive, percentRestored, TotCustExperiencingOutage, TotCustRestored, totEventsActive, and TotalOutages values. I also implemented adjustments to accommodate user-selected date ranges and specific hourly intervals for enhanced data analysis and developed a dynamic Power BI measure to display custom titles reflecting user-selected date and time ranges, providing formatted summaries including 'Storm Start Time' and 'Report Time' based on slicer selections. Clicking on the photo will send you to the GitHub repo!
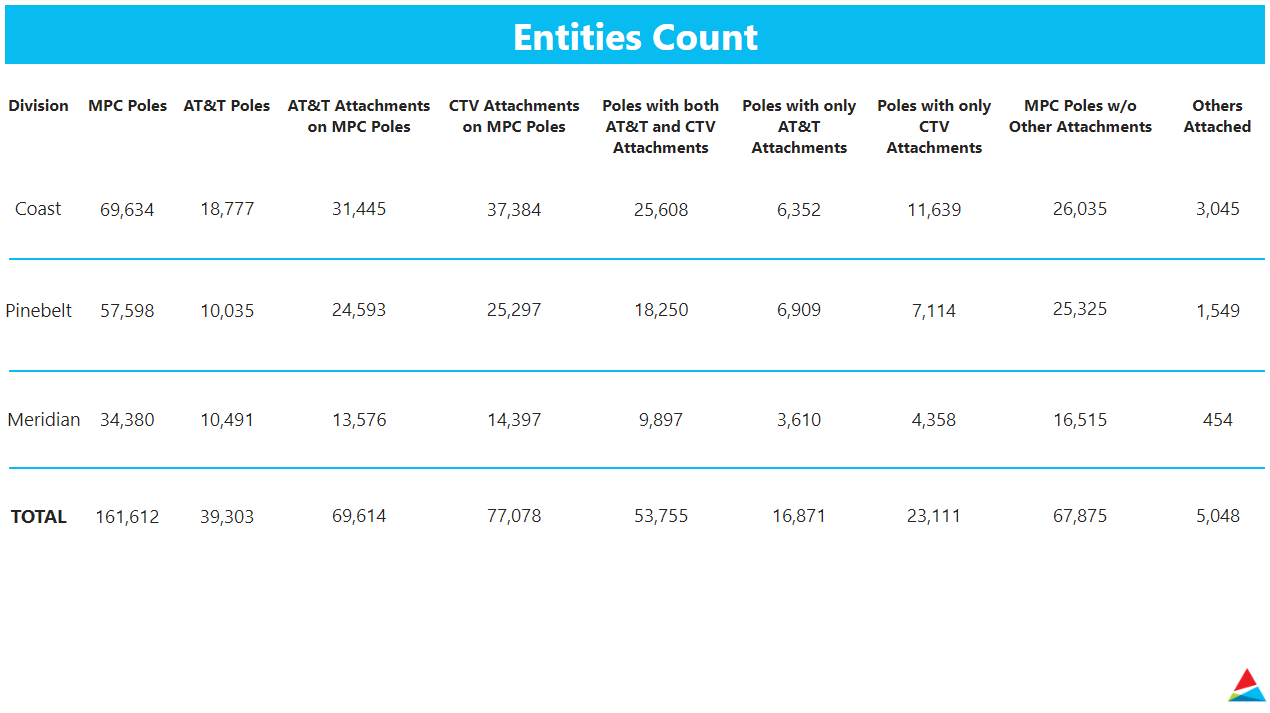
During my internship in 2024, in a project for Mississippi Power of Southern Company, I developed an automated and comprehensive dashboard that revolutionizes the way we manage and analyze our infrastructure assets. This robust tool provides a granular view of MPC Poles, AT&T Poles, and various attachments, enabling detailed monitoring across Coast, Pinebelt, and Meridian divisions. The dashboard intricately displays data on AT&T Attachments on MPC Poles, CTV Attachments on MPC Poles, poles with both AT&T and CTV Attachments, poles with singular AT&T Attachments, poles with exclusively CTV Attachments, MPC Poles without other attachments, and other miscellaneous attachments, ensuring a comprehensive infrastructure overview. The implementation of this dashboard has significantly streamlined our data management processes, saving time and enhancing the precision of our infrastructure assessments. It has empowered Southern Company with the capability to make proactive, data-driven decisions, thereby improving our operational responsiveness and strategic planning. This project not only demonstrates my technical acumen in leveraging Oracle SQL Developer and advanced data visualization tools but also highlights my commitment to fostering technological innovation that drives organizational efficiency and success. Clicking on the photo will send you to the GitHub repo!
Here are some of the STEM-related programs, conferences, academies, and events that I've attended. As there are pictures of my attendance, clicking on them will send you to the website for more information about each event.
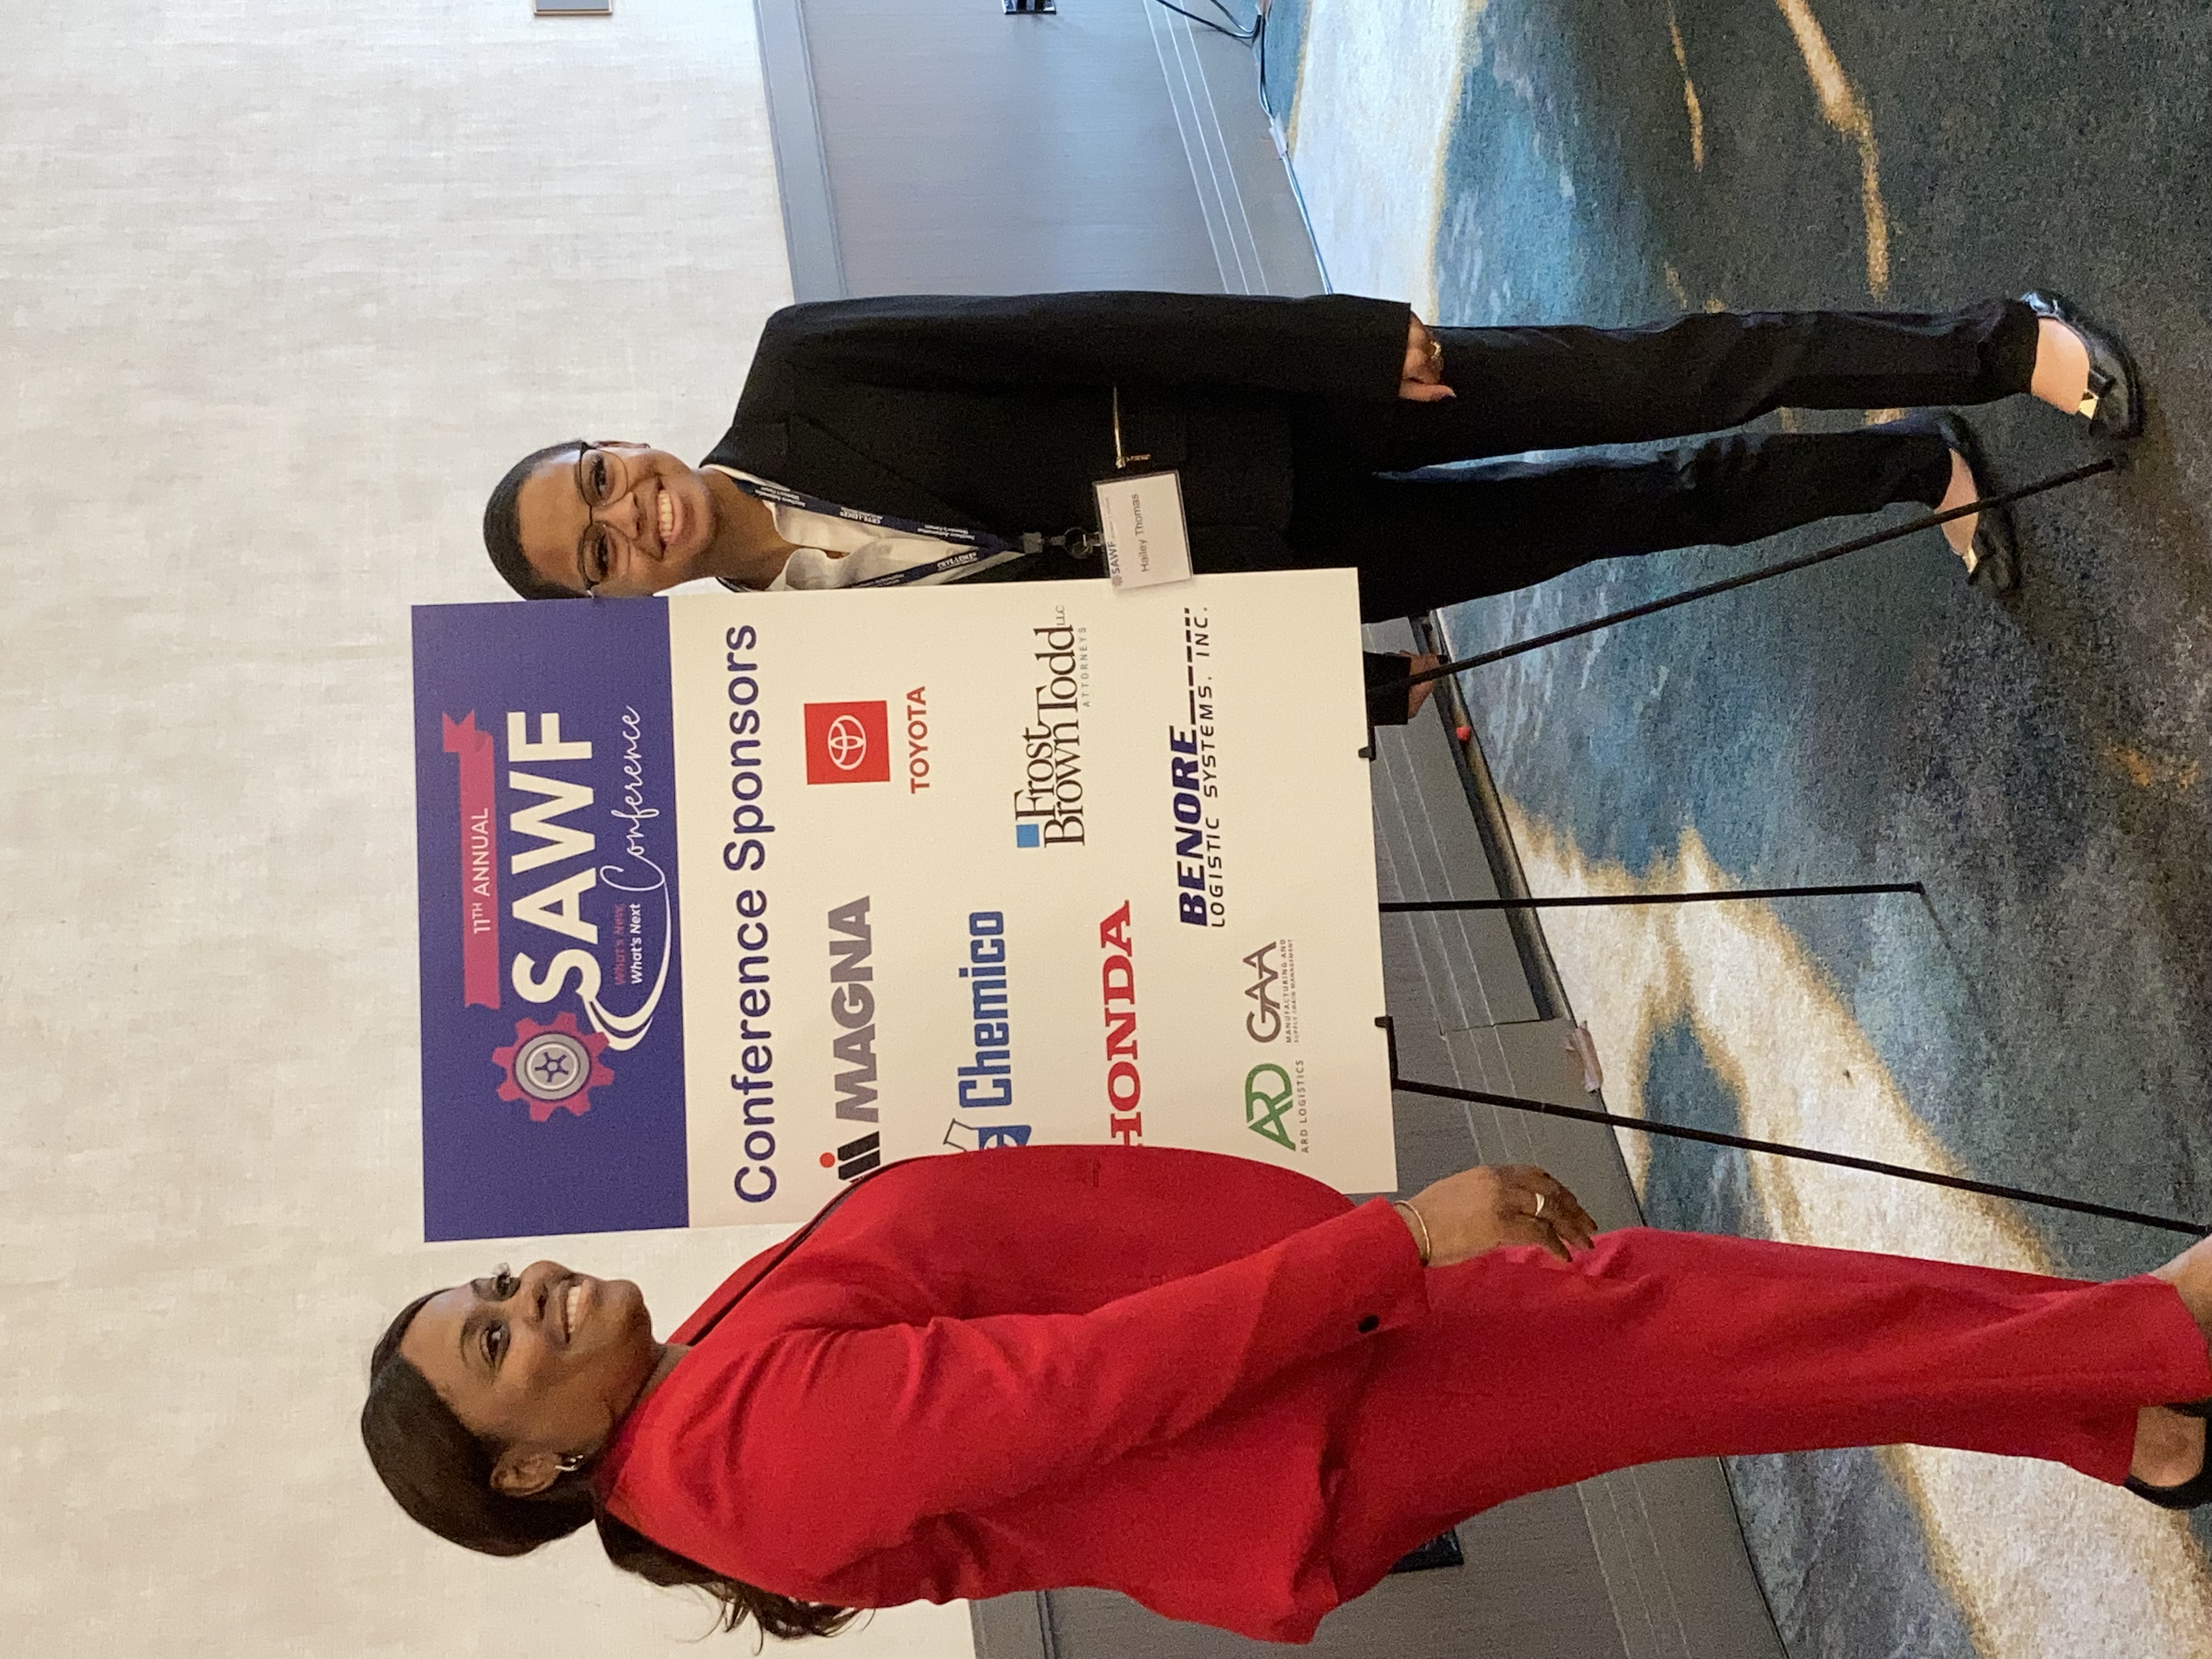
Here is a picture of one of the members of the SAWF and me at the SAWF in Louisville, KY, in 2019. I won a scholarship from SAWF and was able to attend the organization's meeting.
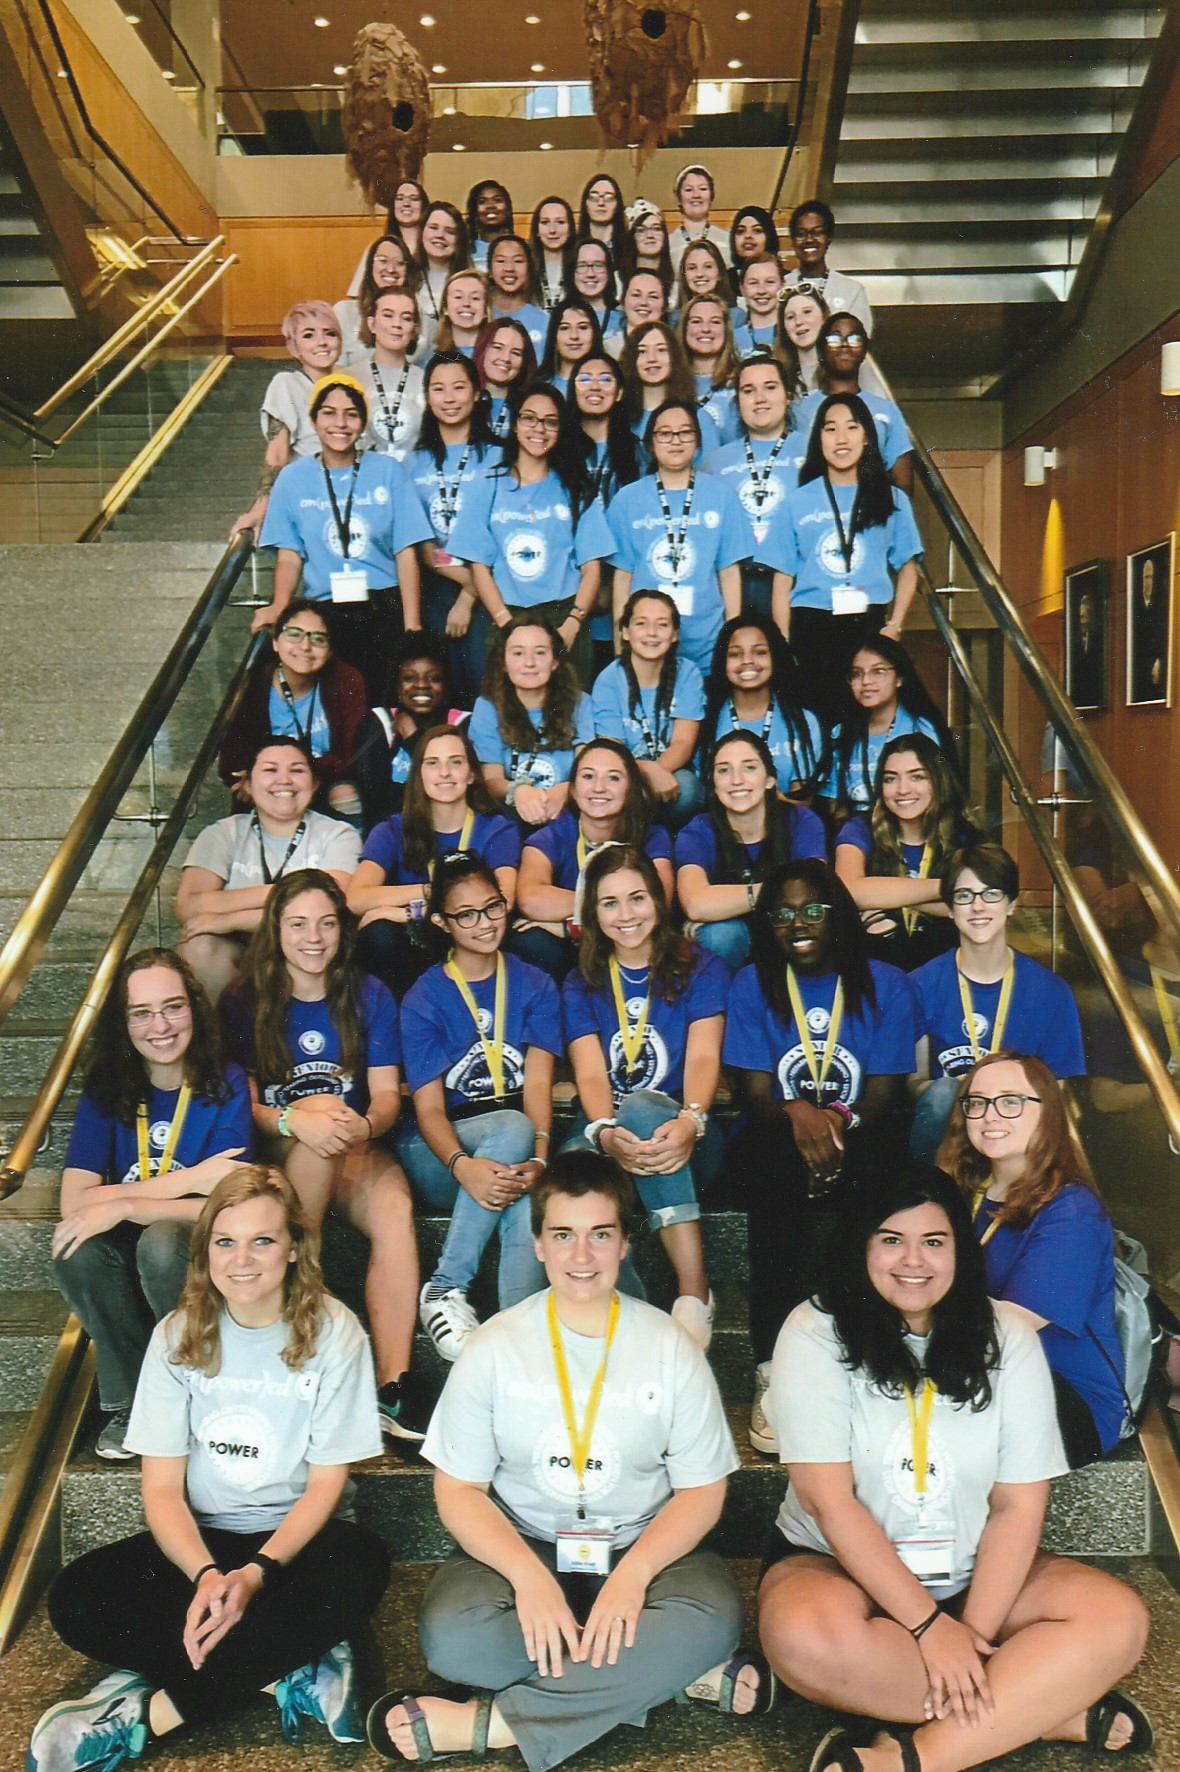
While in high school, I participated in the POWER Senior Academy. I learned about applying for college, finding scholarships, what to expect in collegiate-level classes, and more. POWER Senior Academy also emphasized research, so I participated in a week-long research project with some of IUPUI’s award-winning faculty and staff.
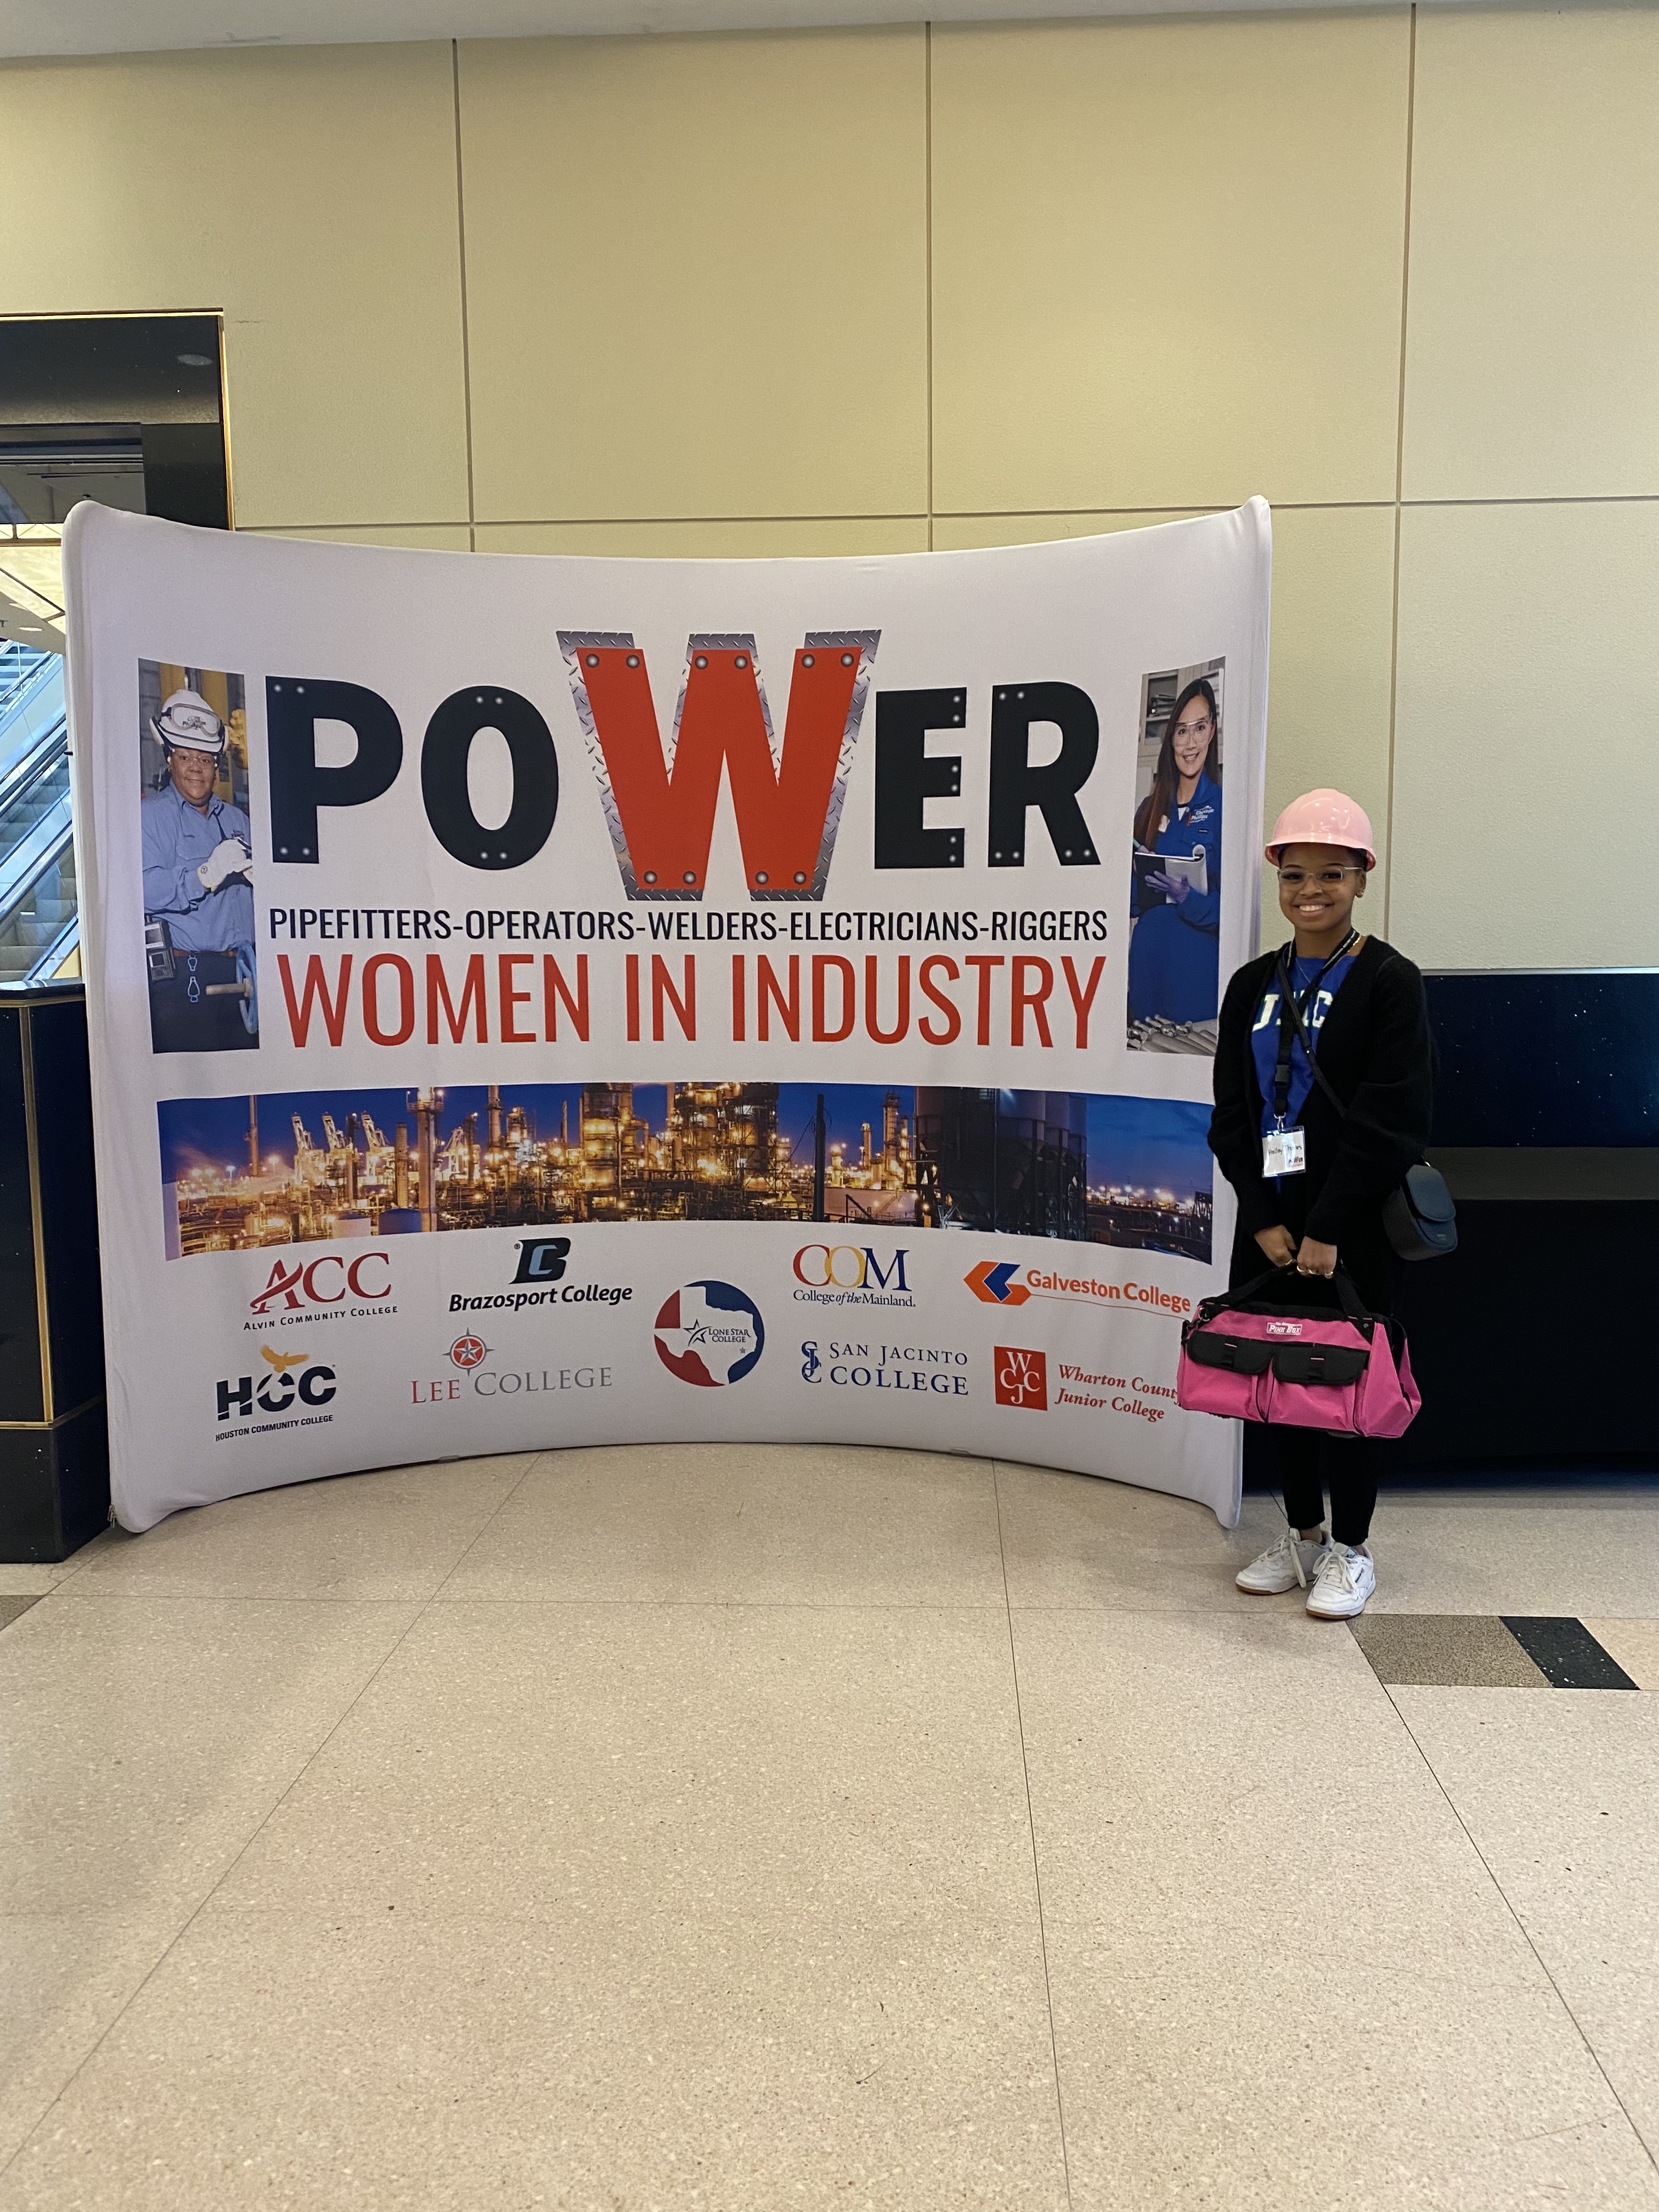
While in college, I attended the Women In Industry Galveston Conference in 2022 and learned about different jobs and fields in the oil, gas, and pipeline industry. I met with different recruiters, attended different career workshops, talked with different employers, and watched as many women in the industry spoke about their careers and experiences.
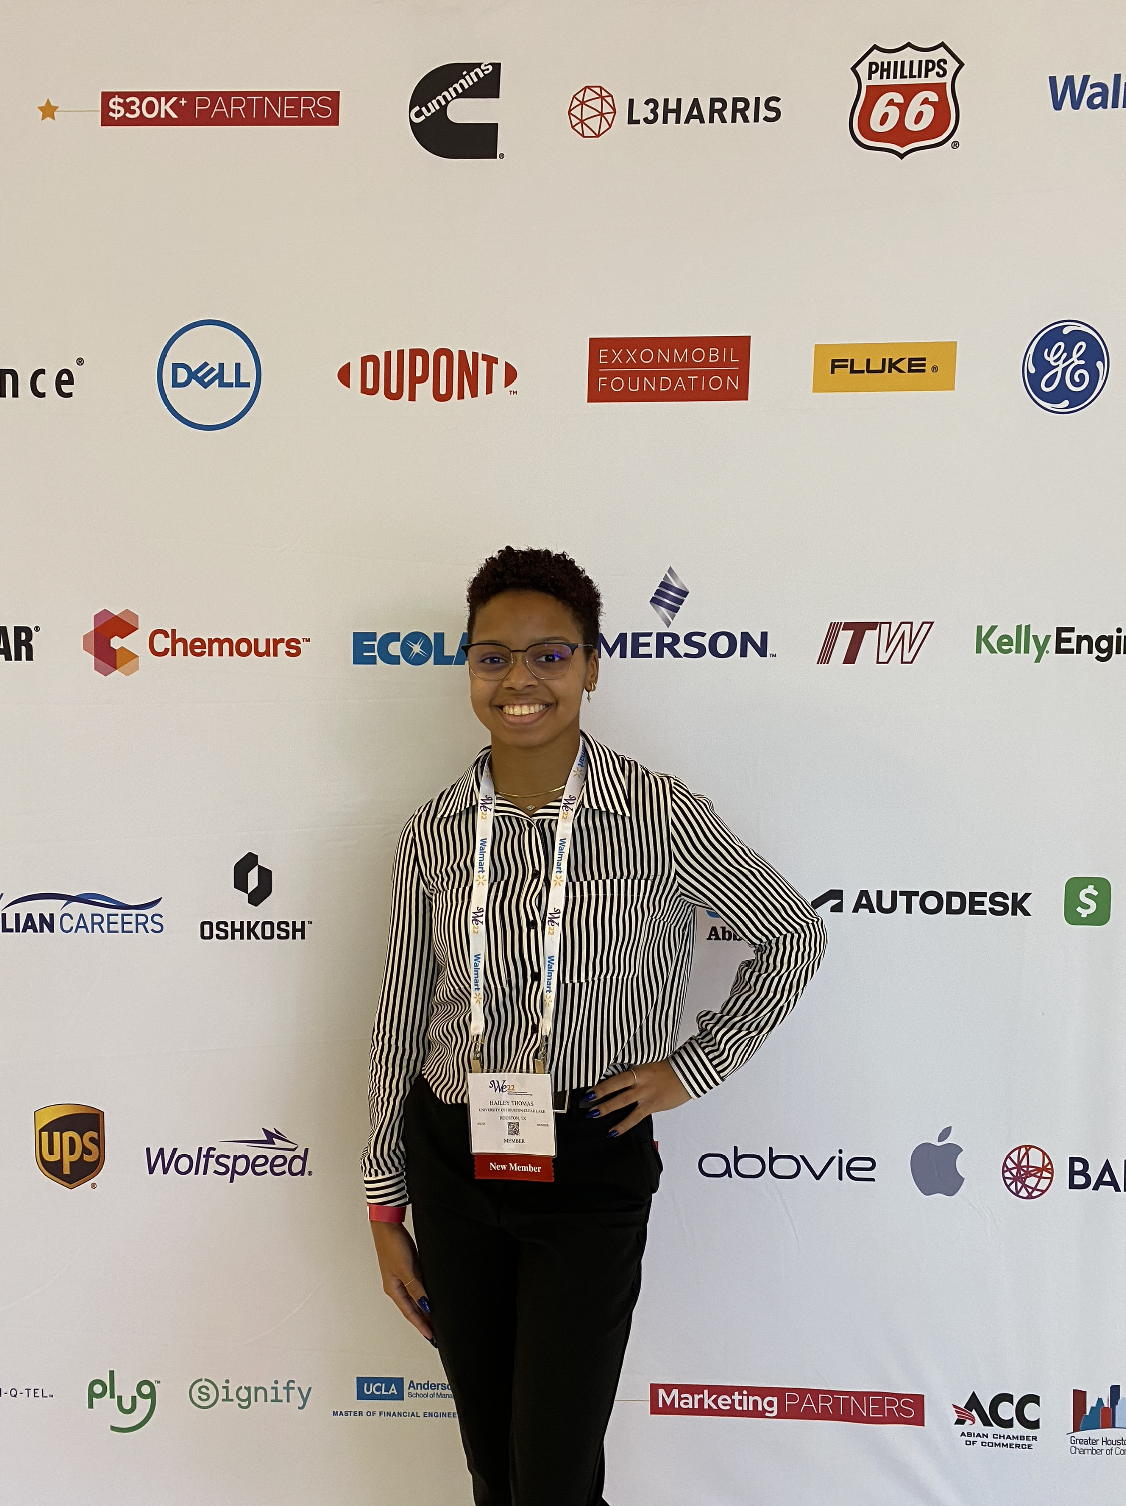
While in college, I attended the 2022 Society of Women Engineers Houston Career Fair and learned about different jobs and fields in the technology industry. I met with different recruiters, attended career workshops, and talked with employers about internships, jobs, and each employee's experience with different companies. I talked to recruiters from Deloitte, CashApp, HP, Apple, AWS, Nike, American Express, HEB, Walmart, and more!
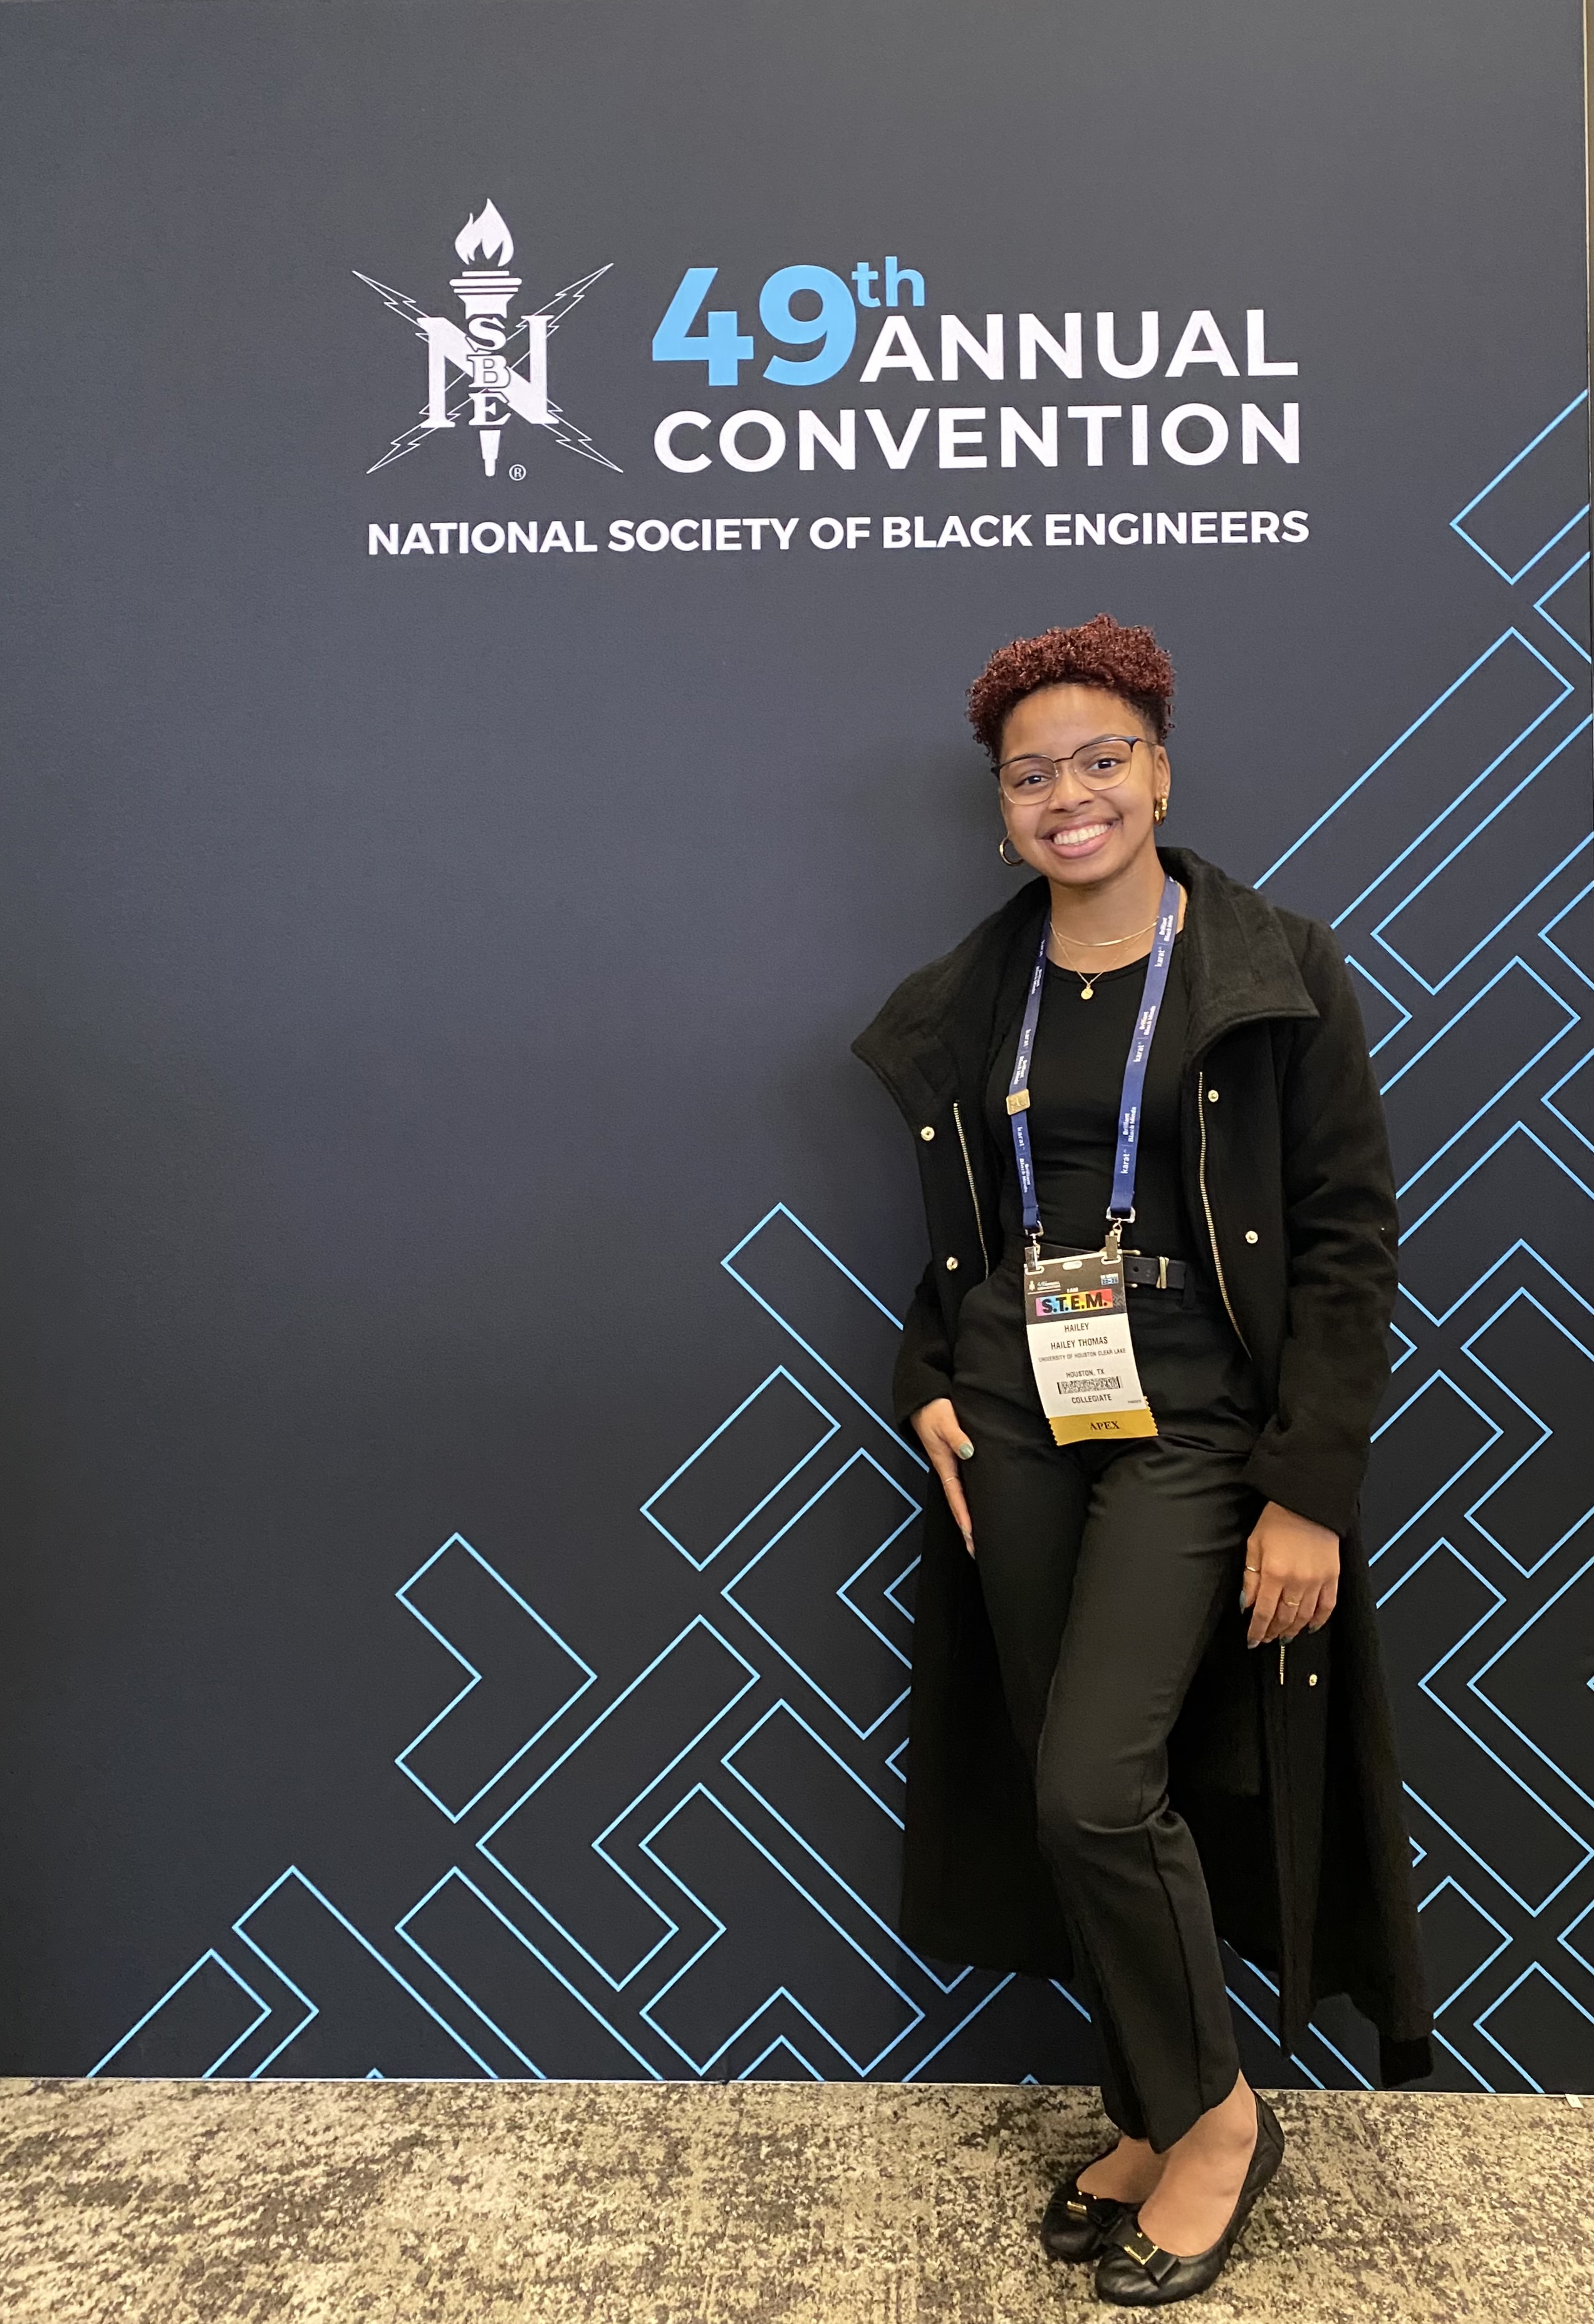
I attended the National Society for Black Engineers' 49th Annual Convention while in college. I learned about different jobs and fields in the technology industry, networked with recruiters and other NSBE members, had on-site interviews with two companies, and went to hospitality suites and panels to learn information about how to negotiate job offers. I met with different recruiters, attended career workshops, and talked with employers about getting internships, jobs, and each employee's experience with different companies. I talked to recruiters from Southern Company, Trane Technologies, HP, Apple, AWS, Wells Fargo, American Express, Karat, Dow, and more!

As a proud member of Rewriting the Code since May 2023, I attended Rewriting the Code's Black Wings Hacks Hackathon 2024 while in college. I learned the fields in the technology industry, networked with other college women and other RTC Black Wings members, had on-site interviews with two companies, and went to hospitality suites and panels to learn information about how to negotiate job offers. I met with different recruiters, attended career workshops, and listened to employers talk about getting internships, jobs, and each employee's experience with different companies. During the Hackathon I collaborated with my team members Khanh Ha Nguyen, Martha Aponbiede, and Rubal Khehra to create a comprehensive website for a US Food Relief Network for College Students project using ReactJS.
Would you like to connect and network with me? Do you have any questions? Leave a message, and I'll reply as soon as possible.